The MACD is green for the first time since Bitcoin’s all-time highs, but a correction is the “most obvious” first step, one trader says.
(adsbygoogle = window.adsbygoogle || []).push({});
6671 Total views
21 Total shares


Bitcoin (BTC) kept traders guessing later on Aug. 18 as one forecast said that a $40,000 dip would be the “most obvious” next move.


$37,000 is last chance saloon for BTC
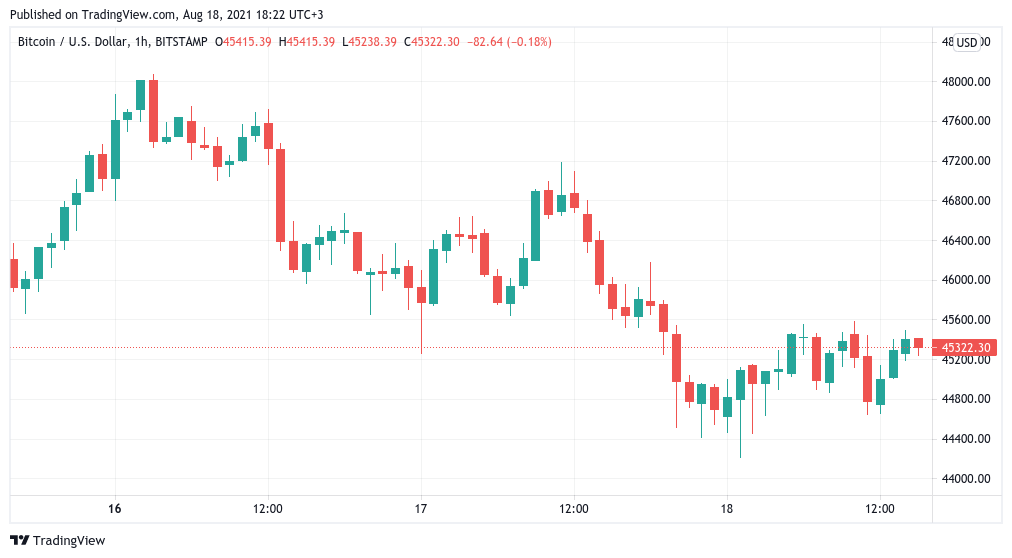
Data from Cointelegraph Markets Pro and TradingView followed BTC/USD as it ranged around the $45,000 mark on Wednesday, with no clear direction on lower timeframes.
A dip to $44,200 earlier in the day reversed upward, but the pattern for the pair remained a cycle of lower highs on the hourly chart.
Therefore, Cointelegraph contributor Michaël van de Poppe concluded, a higher low construction marking a corrective phase could appear “quite quickly.”
“The most obvious case for the markets right now is that we’re going to have that corrective move somewhere towards the region of $39,000 to $42,000,” he said in his latest YouTube update.
Van de Poppe added that the line in the sand for bulls was around $37,000, which marks the last higher low construction supporting Bitcoin in its current trading zone.
A “crucial breaker” to the upside, he subsequently said, was the $45,600 area, which at the time of writing was just several hundred dollars away.
MACD back for first time since Bitcoin all-time highs
Zooming out, further context provided bulls with some much-needed respite thanks to one key indicator flashing “buy.”
Related: 3 ways this Bitcoin bull run is different than late 2020
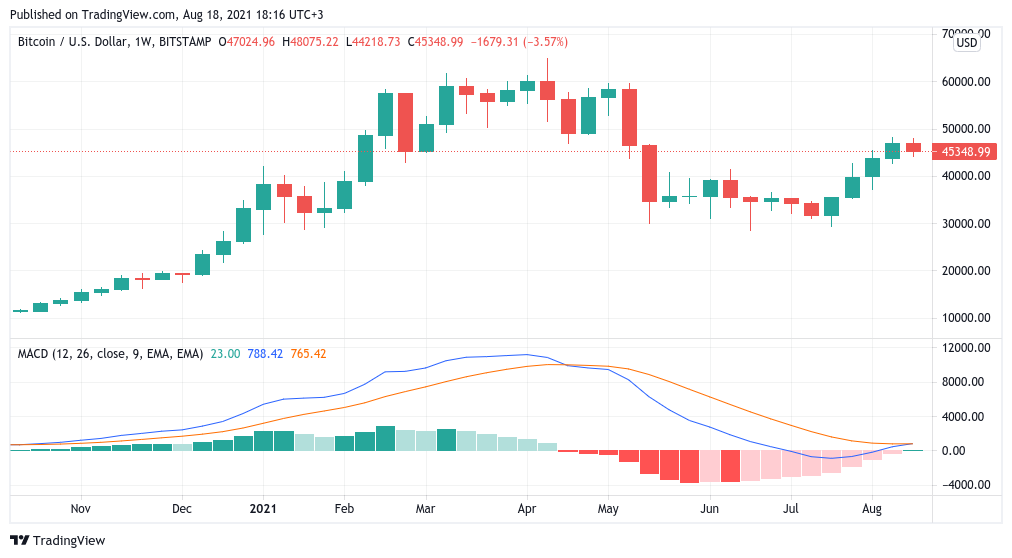
That came in the form of the weekly moving average convergence/divergence (MACD) tool, which as of Aug. 8 has flashed green for the first time since Bitcoin was at its all-time highs of $64,500 in April.
The MACD is a classic interpreting method for charting an asset’s overall trajectory. The last time such a green phase began was in early Q4 2020, corresponding with the springboard for the latest bull run to get going.


As popular Twitter commentator BTC Archive noted last week, a similar green event in 2019 led to considerable price appreciation.
![]()
![]()
