

At a glance
Expert’s Rating
Pros
- Stupidly good multi-core performance
- Really good single-core performance
- Value that breaks new ground
Cons
- DDR5 option drives up pricing
- Prices likely to be initially high
- If you just game, who cares what CPU you have?
Our Verdict
Intel’s 12th-gen Core i5-12600K offers stunning performance over its AMD Ryzen rival—and offers consumers unheard-of value too.
Price When Reviewed
$289
Best Prices Today
$319.99
Free
$319.99
Adorama
Not Available
Free
If there was ever a CPU designed solely for revenge, Intel’s 12th-gen “Alder Lake” Core i5-12600K would be it.
Based on Intel’s new—and surprisingly good—hybrid CPU design that includes a mixture of high-performance cores and high-efficiency cores, the Core i5-12600K deals a death blow to AMD’s popular Ryzen 5 5600X in just about everything you can run on it. Looking at its superior performance over the Ryzen 5, we almost want to throw a penalty flag for unsportsmanlike conduct for way Core i5 chip runs up the score on to Ryzen 5. This is the new mainstream desktop processor to beat.
What is 12th-gen Core i5-12600K?
Our previous Intel Alder Lake reveal coverage dug deep into the makeup of these radical new 12th-gen Core chips, as well as hard details about the individual chips in the lineup and platform/motherboard details. Be sure to check it out if you aren’t up to speed on what’s going on in Intel’s new architecture yet.
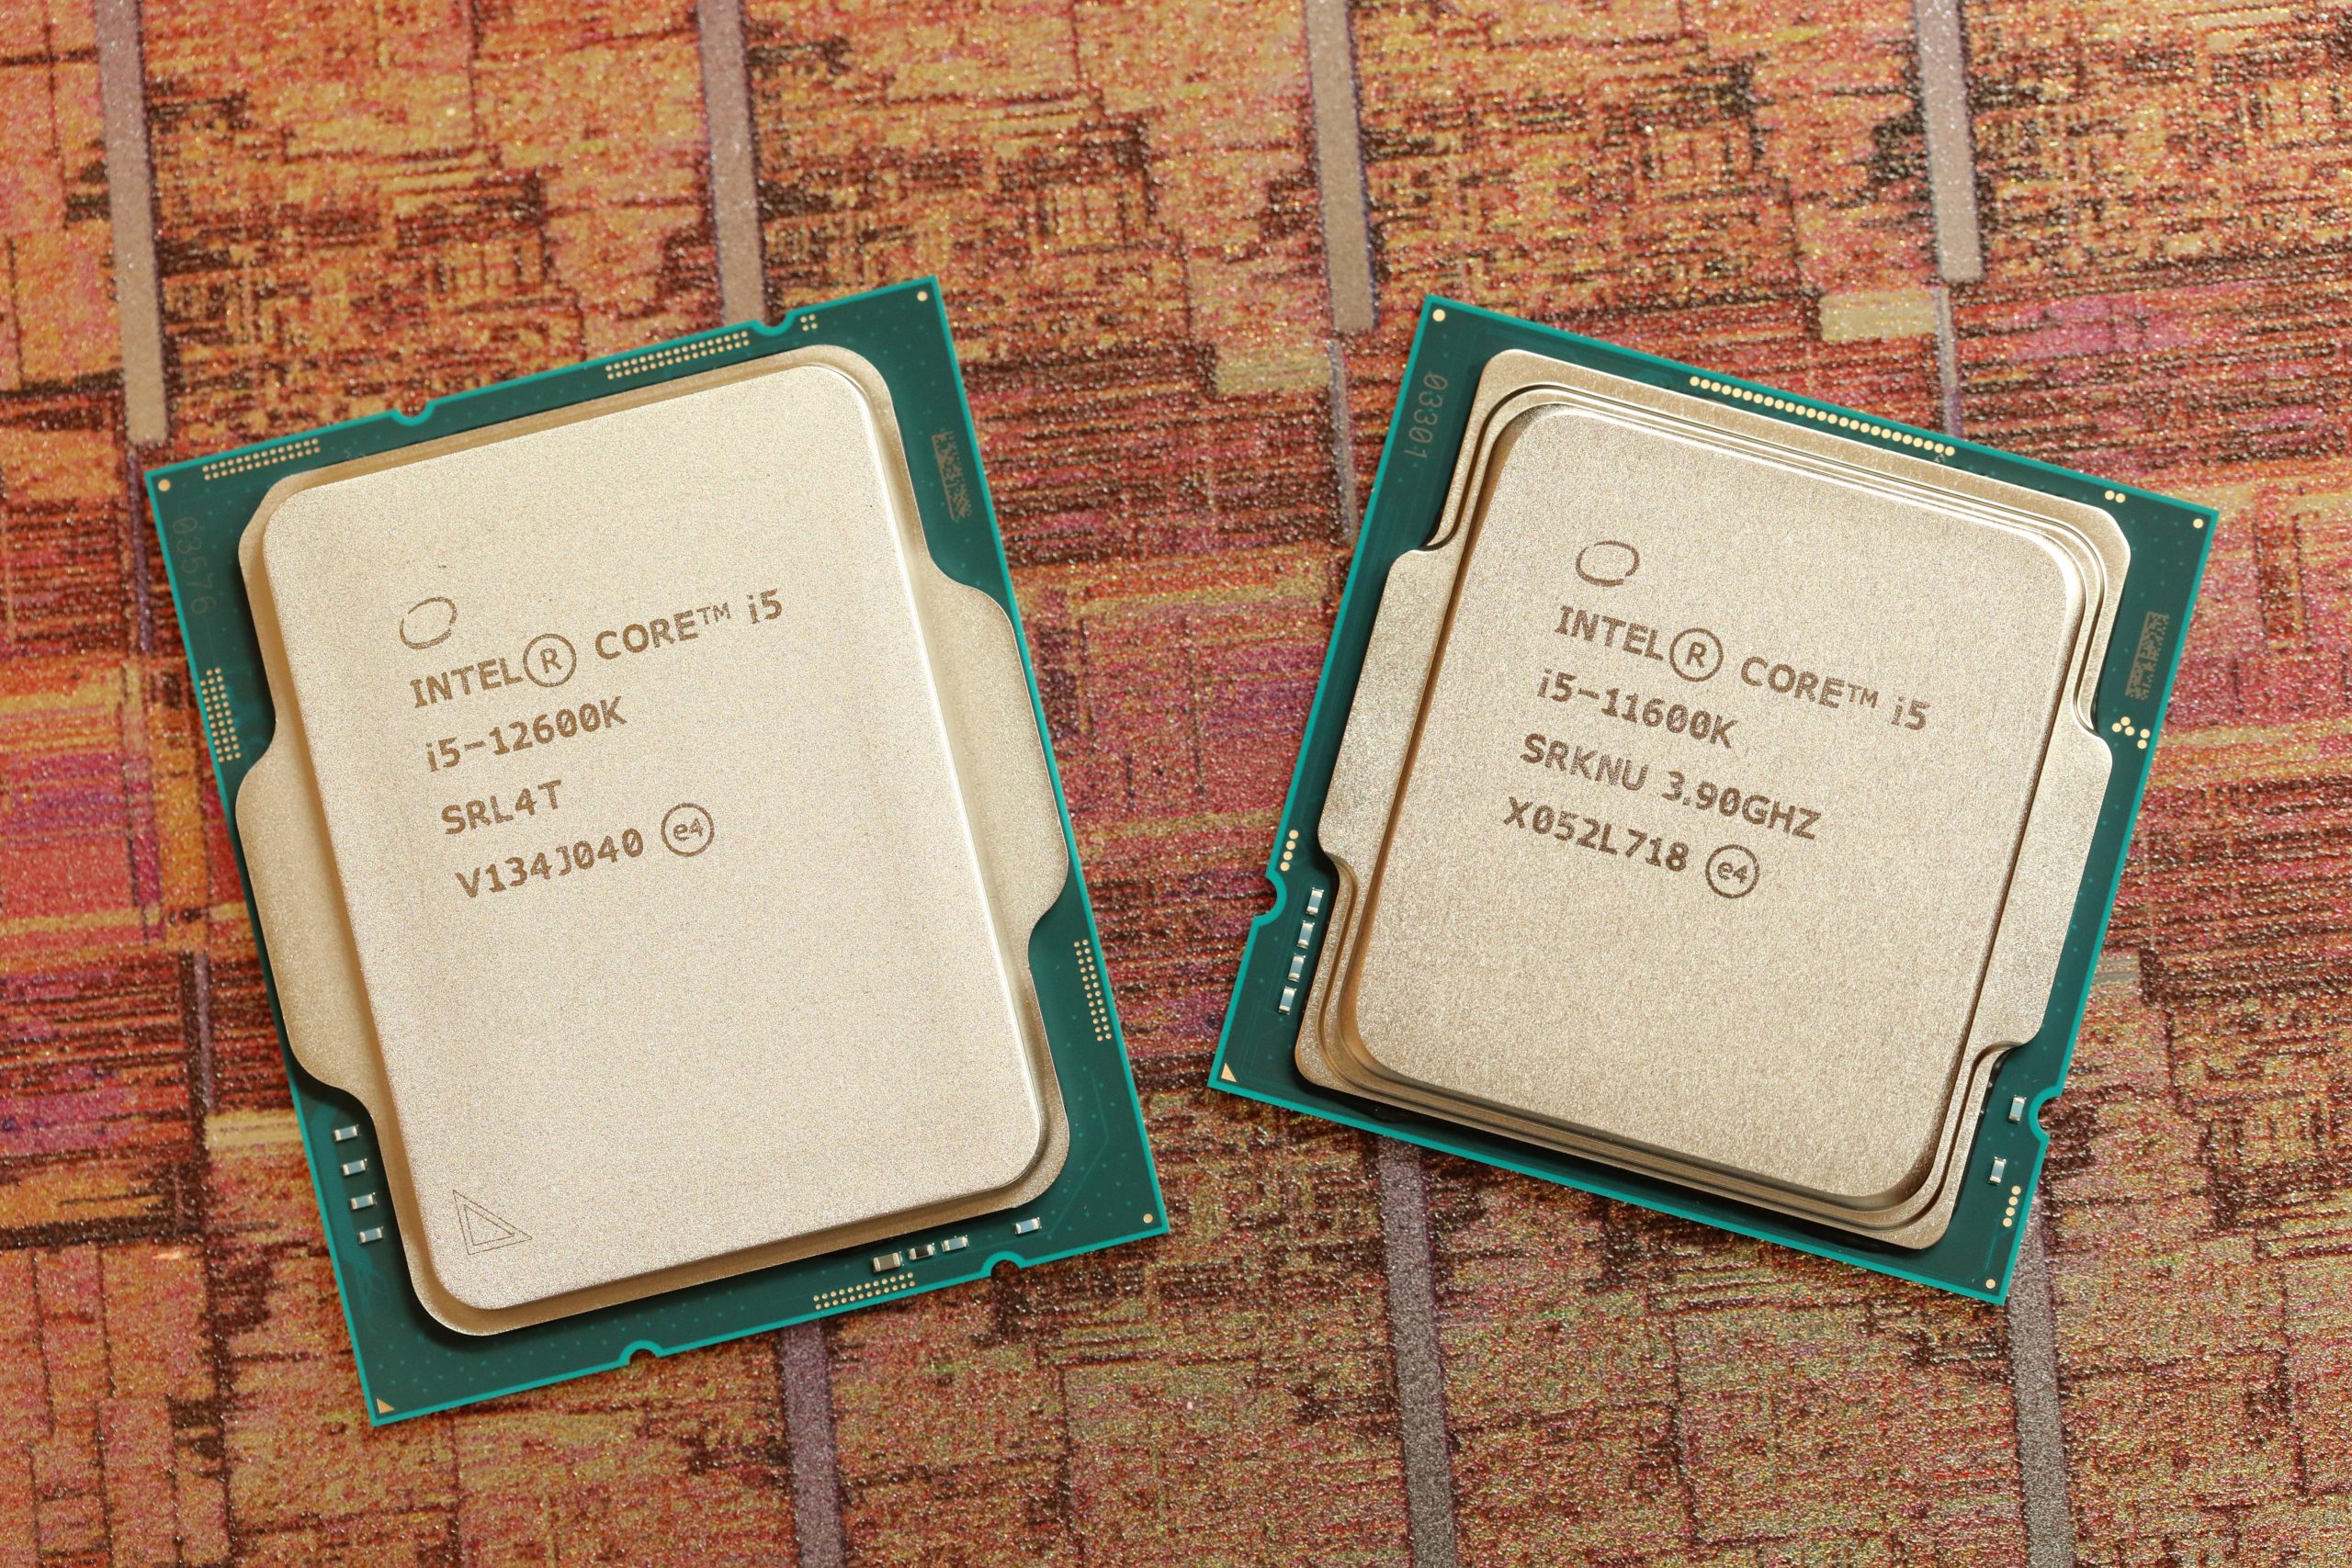
As for the Core i5-12600K, in a nutshell, it is the affordable version of Alder Lake that most people will buy. Sure, the flagship Core i9-12900K nabs the headlines, but the price and value of the Core i5 makes it the one to have. This chip comes with 10 cores/16 threads (6 hyperthreaded performance cores at 3.7GHz/4.9GHz, 4 efficiency cores at 2.8GHz/3.6GHz).
How we tested
You can read more details about the hardware we used to test these two CPUs in our Core i9-12900K review, but we’ll just say both are on on even ground with the latest patches and drivers applied to address previously reported performance issues for Ryzen on Windows 11. We also want to note that our CPU’s L3 cache latency performance looked fine.

Gordon Mah Ung
Rendering performance
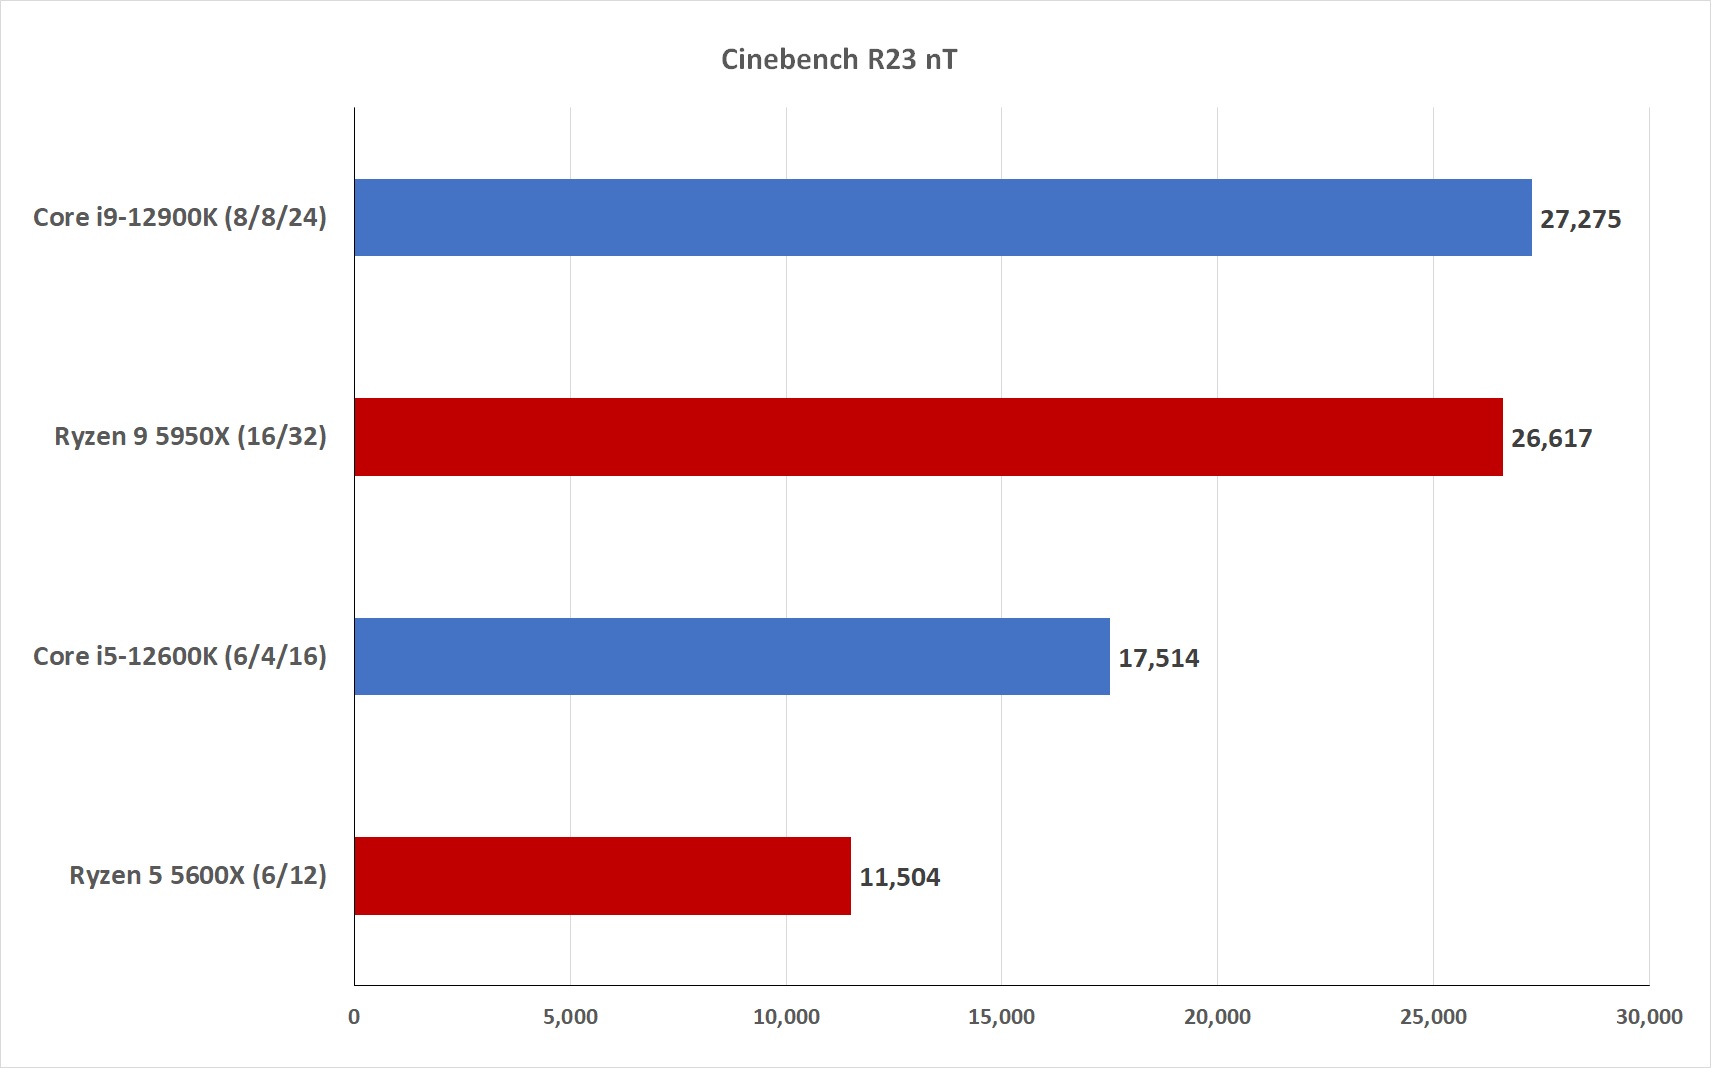
We’ll kick this off in the highly-watched (yet arguably little used) area of 3D rendering using Maxon’s latest Cinebench R23 benchmark. Intel still frowns on 3D rendering performance testing on the outside, but inside, it’s likely all smiles as the 12th gen Core i5 offers a crazy 52 percent performance increase over the Ryzen 5! Fifty. Two. Percent. Exclamation point.

IDG
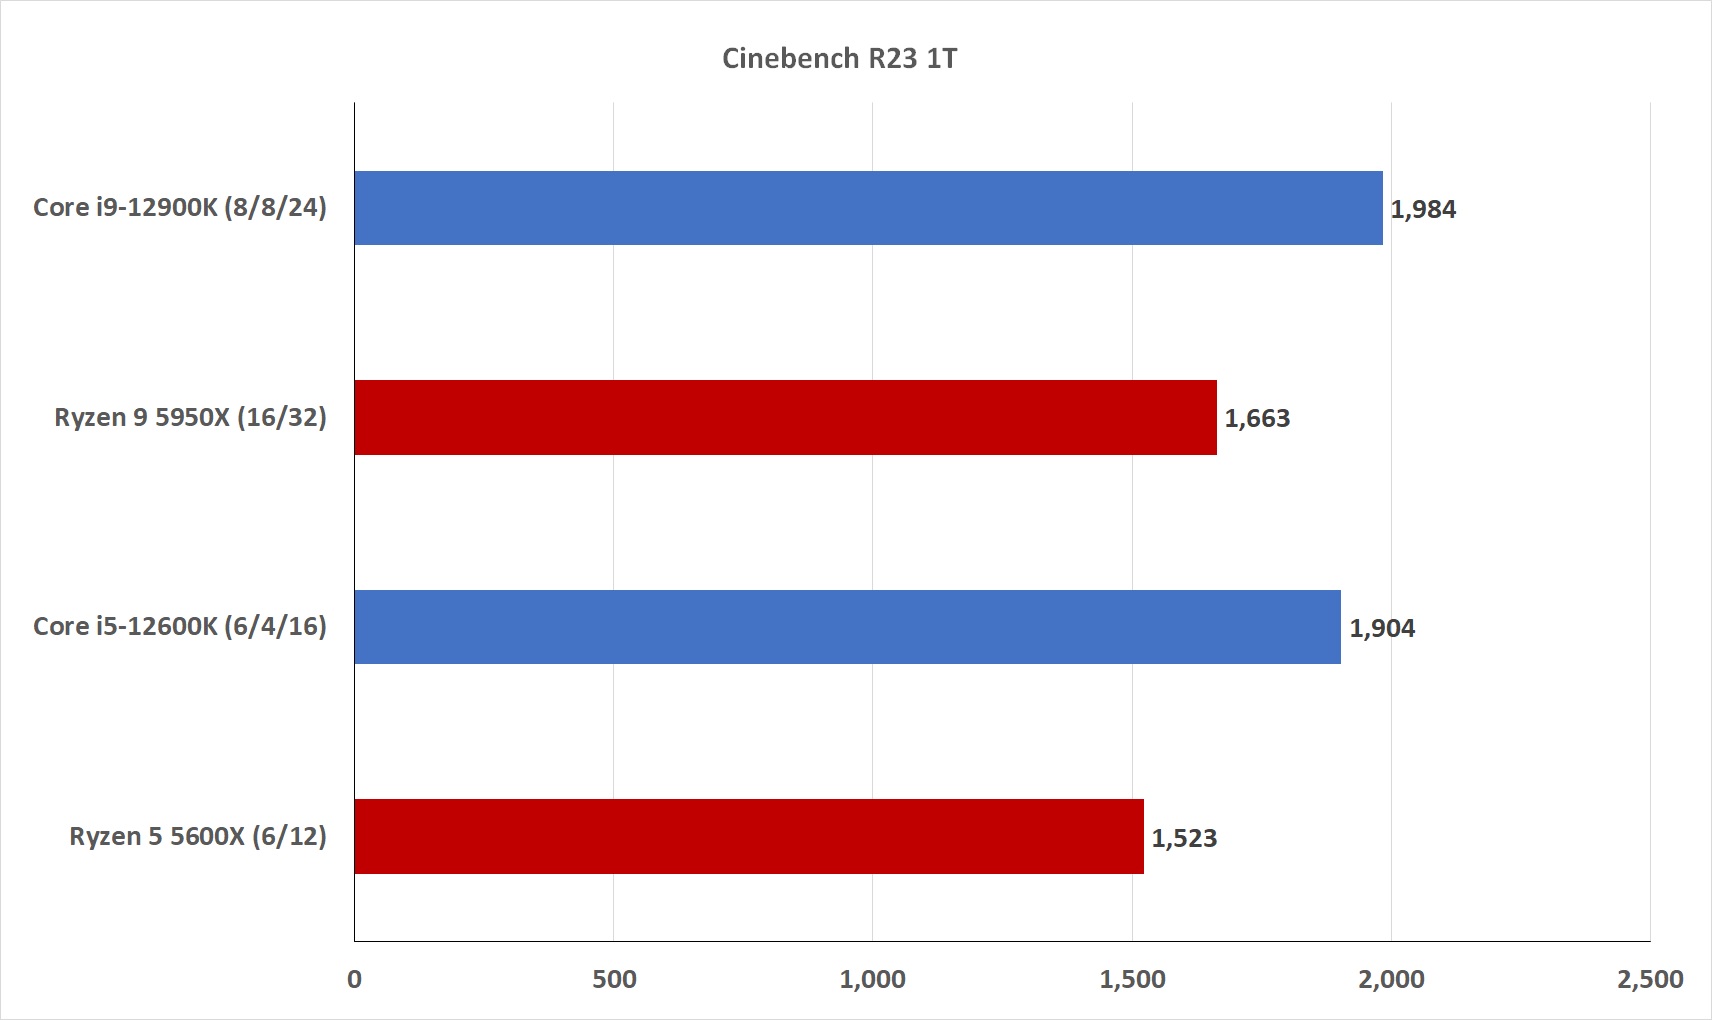
We also run Cinebench R23 using a single-thread because few applications actually use all the cores in modern CPUs. While the all-core result above might tell you how fast a processor can handle 3D rendering or maybe video encoding, single-core performance generally indicates how well it runs most actions in Photoshop, browsing, or while using Office. The Core i5-12600K has it handled there too with a commanding 25 percent lead over the Ryzen 5 5600X.

IDG
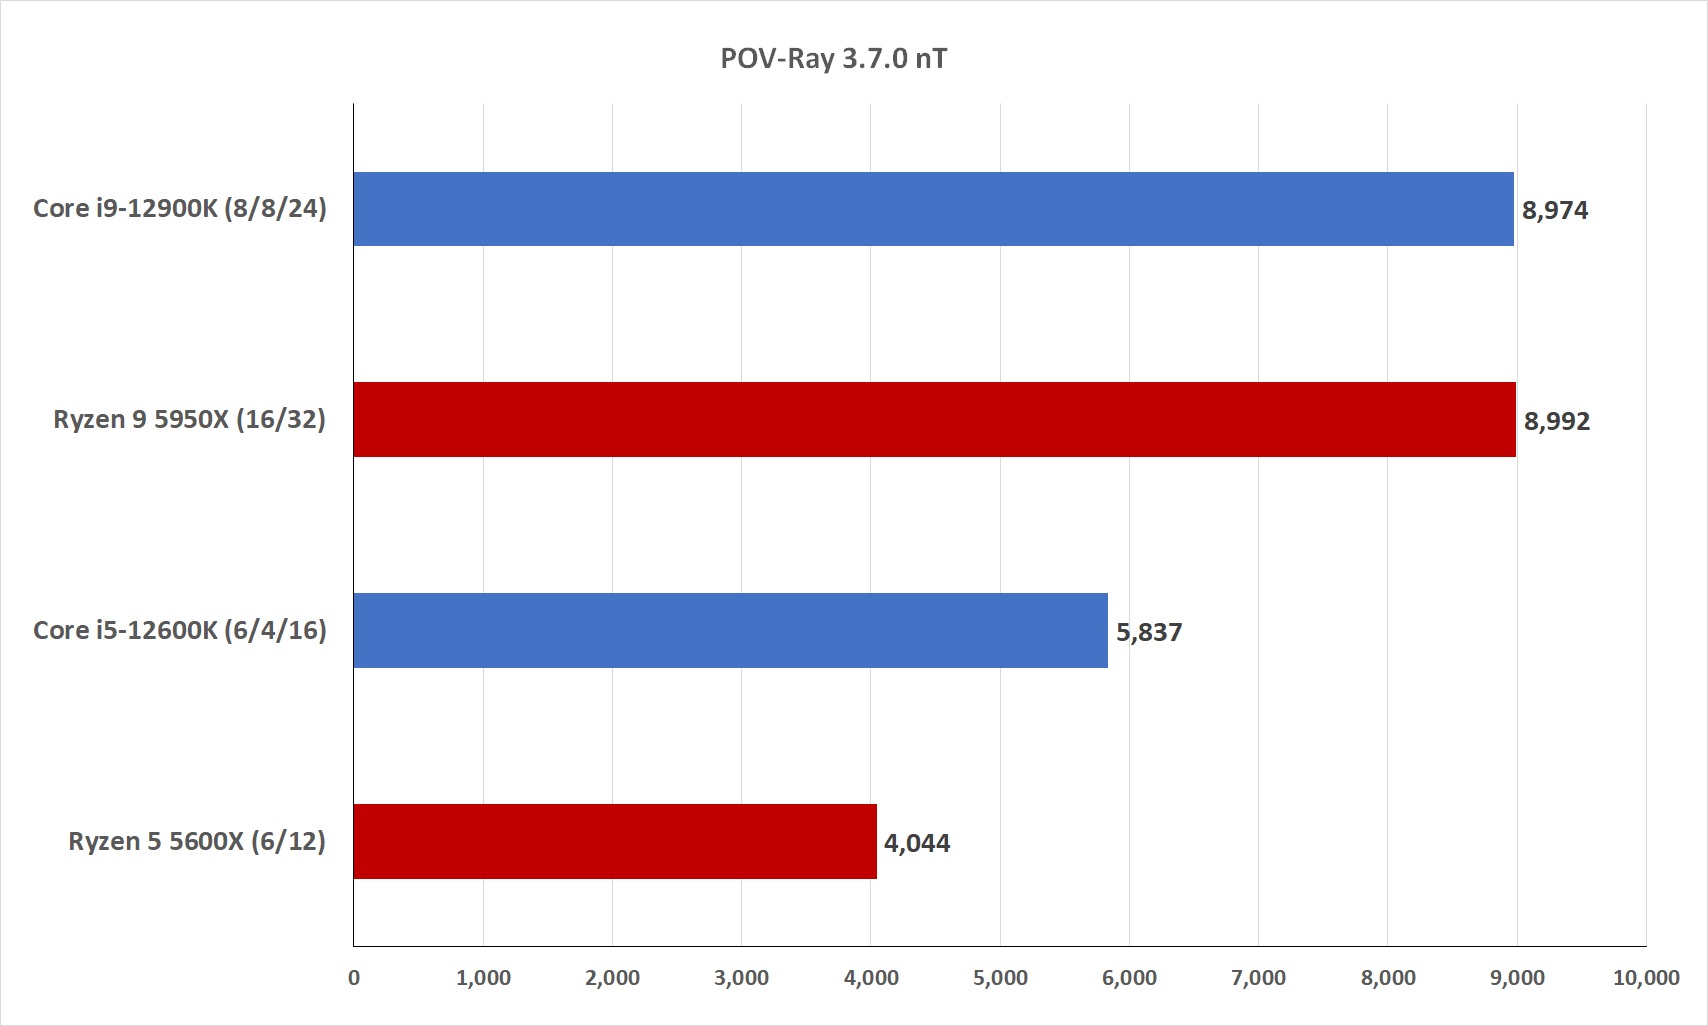
Our next 3D rendering benchmark, POV-Ray, uses a test that dates back to the origins of the Amiga, but has been updated over the years. Its claim to fame is the ability to create beautiful ray traced images using a few lines of text. The Core i5-12600K’s lead isn’t as big here as it was in Cinebench R23, but it’s still nothing less than a gobsmacking 44 percent more performance than a Ryzen 5 5600X.

IDG
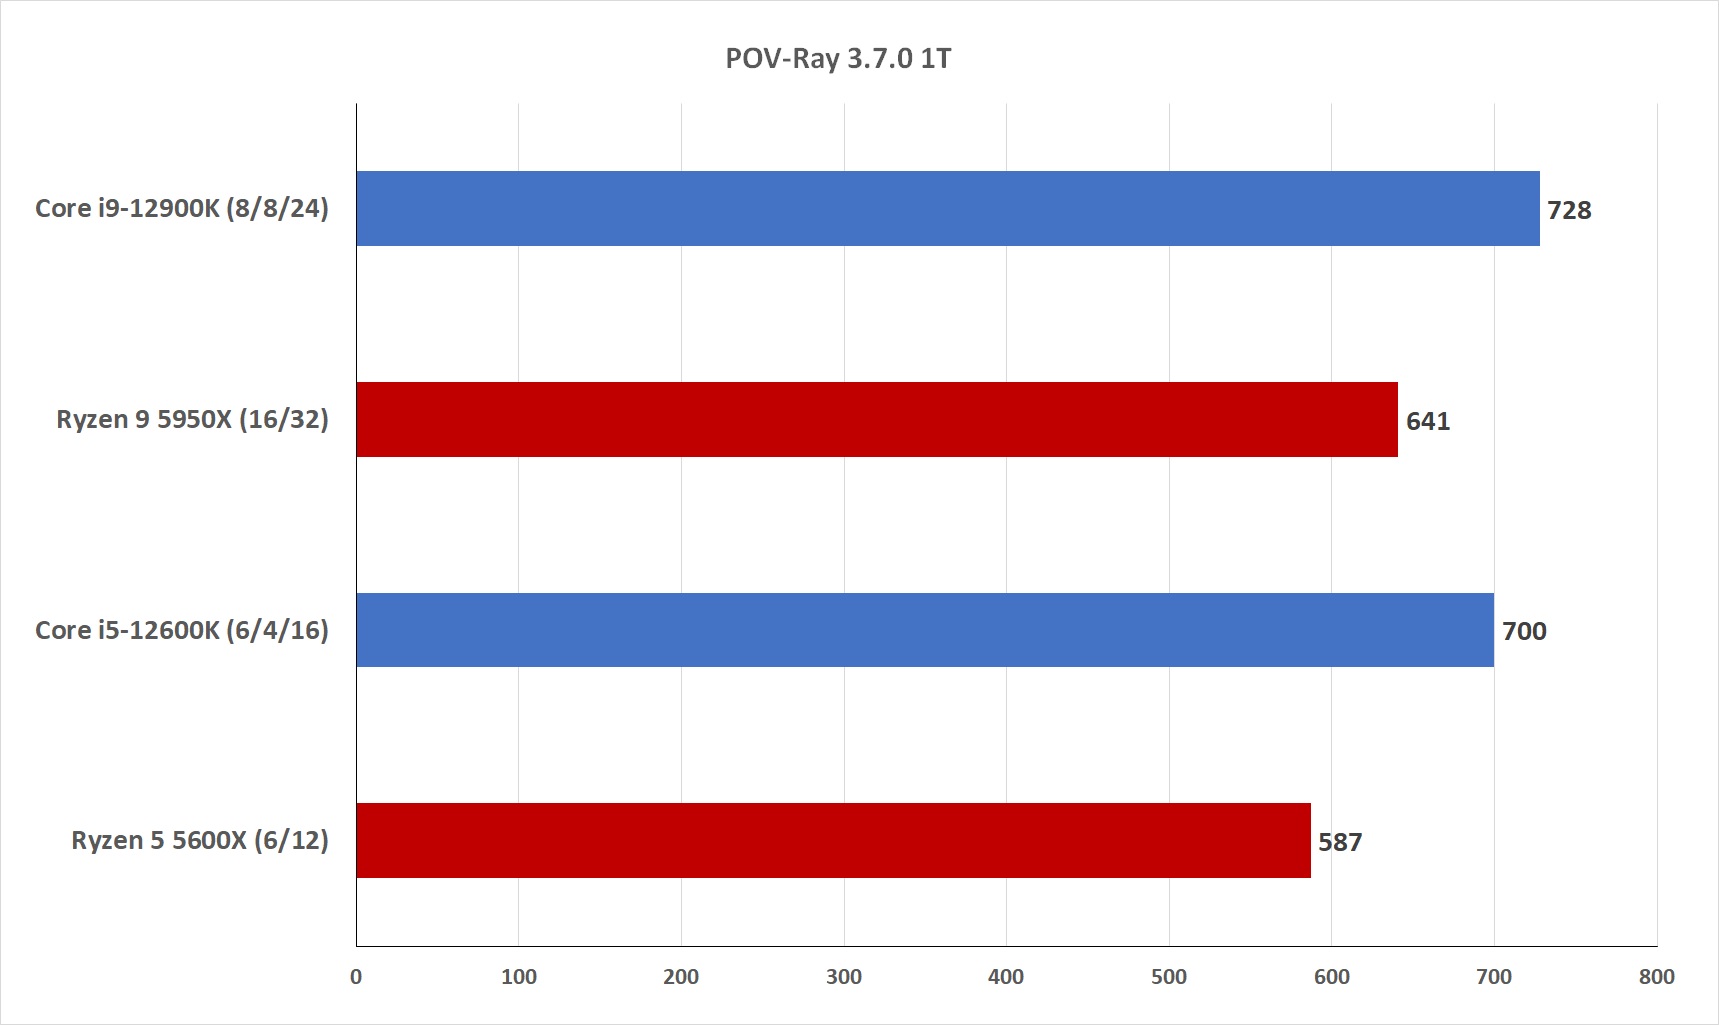
Like Cinebench, there’s also an option to look at single-threaded performance in POV-Ray. We again see the gap close a little bit but not enough to matter, with the Core i5-12600K delivering a 19 percent performance lead over the Ryzen 5 5600X.

IDG
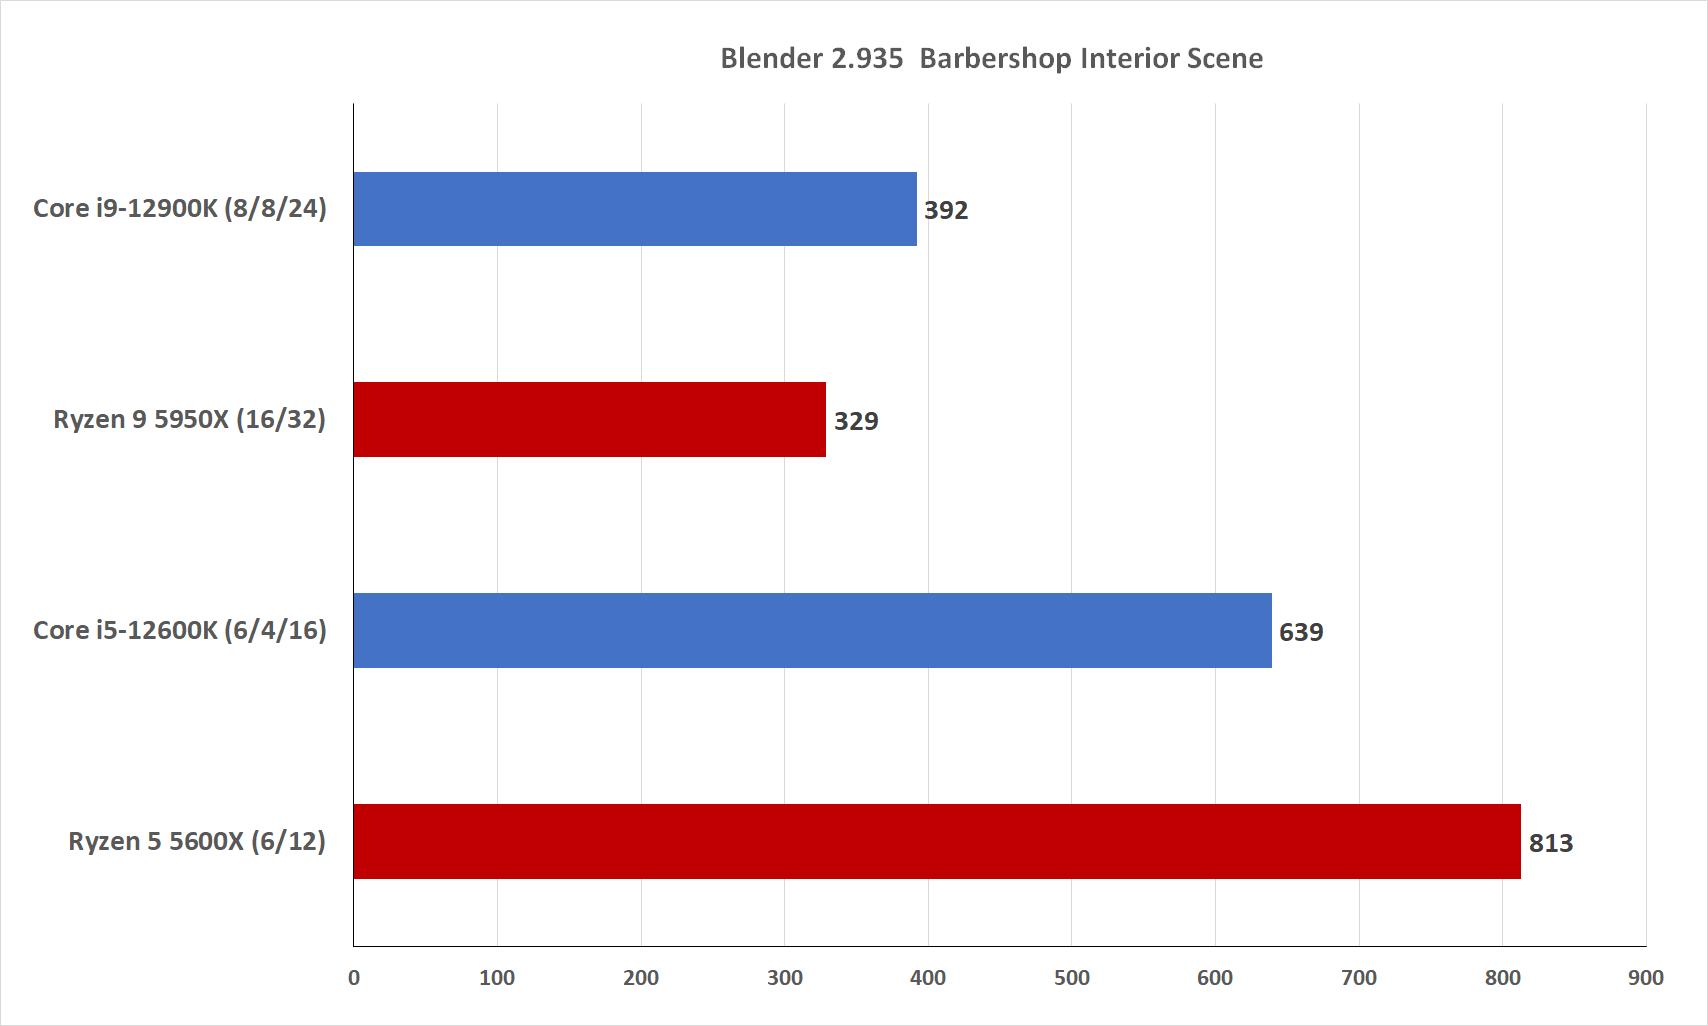
Continuing with 3D rendering, we also test the open source Blender 2.93.5 with the Barbershop Interior benchmark scene. While 12th-gen Core i9 actually loses to the Ryzen 9 here—we think in part to the additional threads the Ryzen 9 has—the more mainstream Core i5-12600K has to make no such apologies by finishing the render scene in 16 percent less time than the Ryzen 5.

IDG
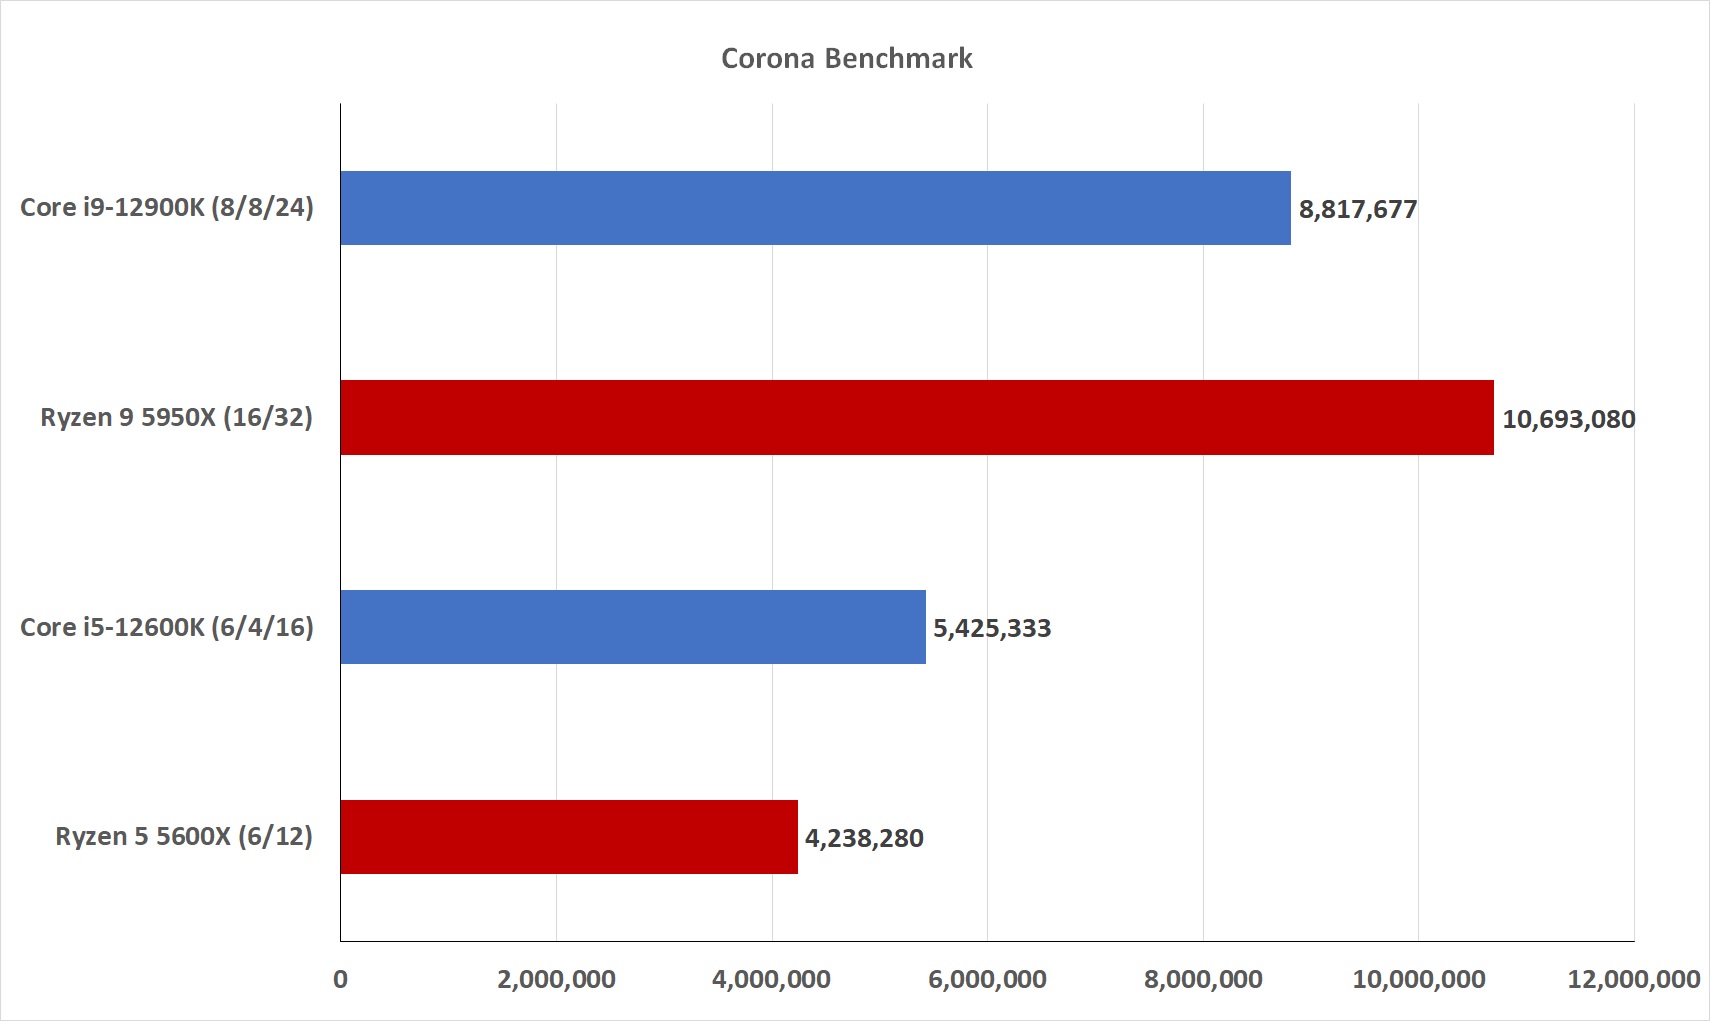
At this point, we think you get that the ten cores of the Core i5-12600K easily crush the six cores of the Ryzen 5 5600X. We’d say no mas, but AMD has been crushing Intel in multi-core performance for years so it doesn’t feel fair to stop now just because the situations are reversed. So yes, the 12th-gen Core i5 holds a significant 28 percent lead over the Ryzen 5 in the Corona rendering benchmark.

IDG
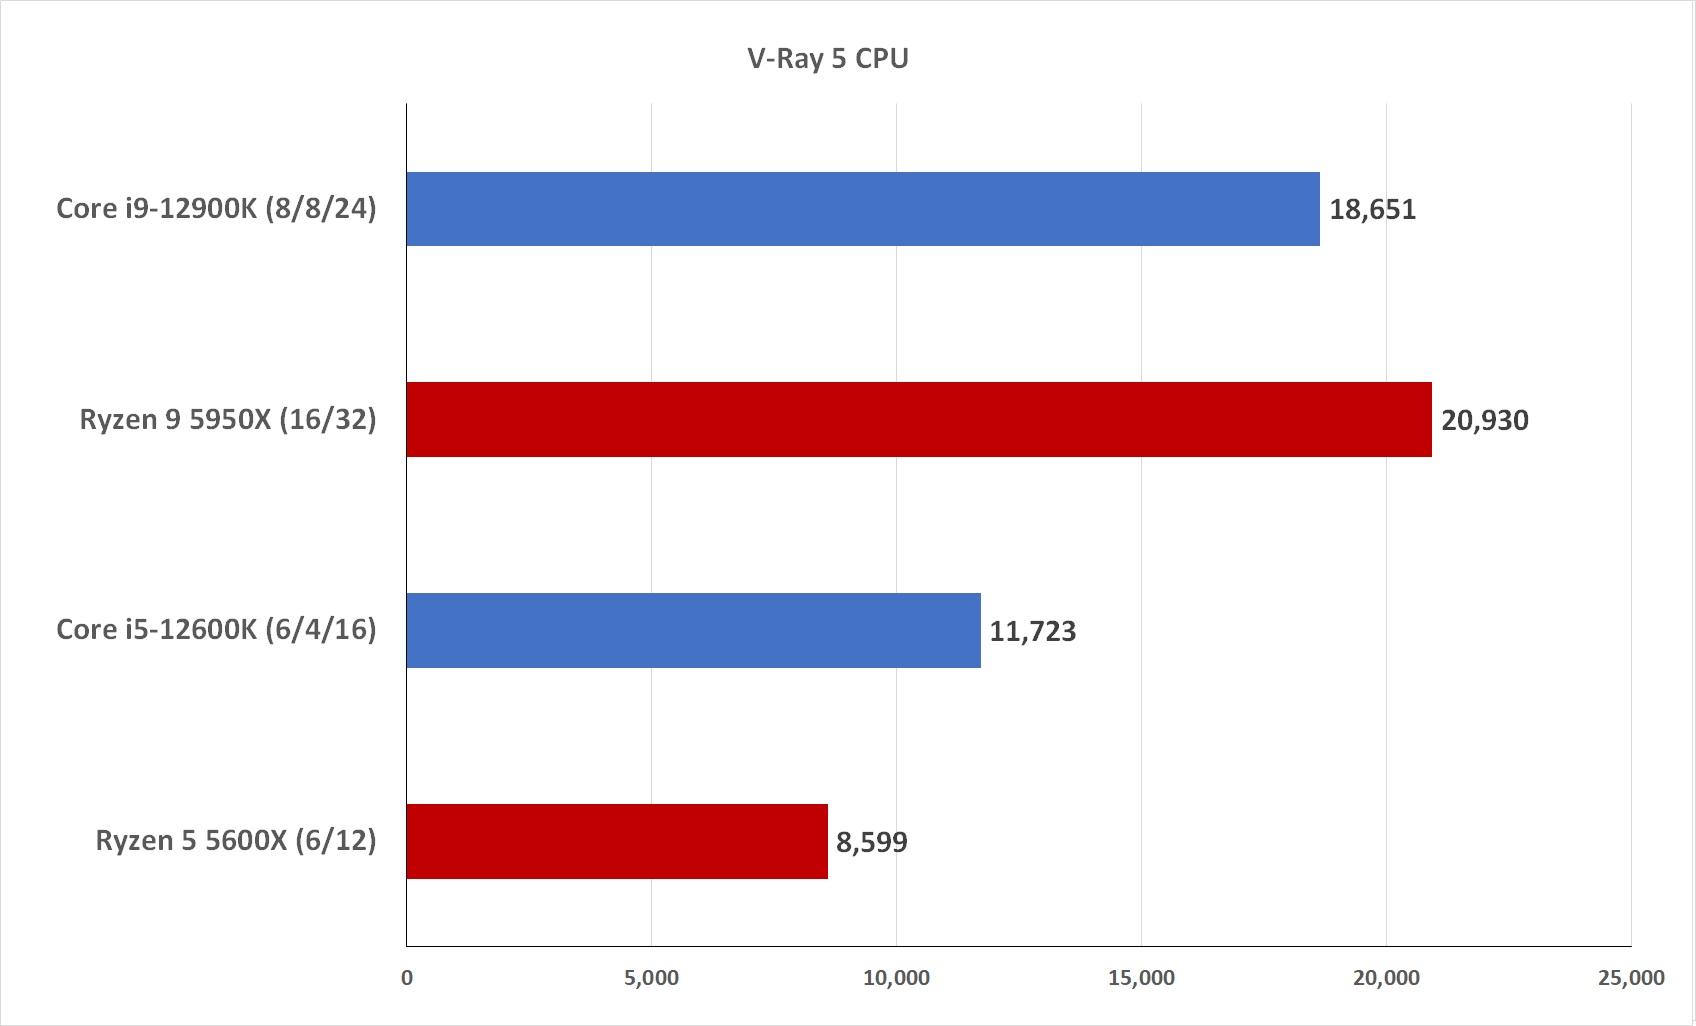
Our last rendering benchmark is Chaosgroup’s V-Ray 5, which gives the Core i5-12600K another crushing 36 percent advantage over the Ryzen 5. Let’s just conclude that for anyone who needs a budget CPU for 3D rendering, Ryzen 5 gets cooked by 12th gen Core i5.

IDG
Compression performance
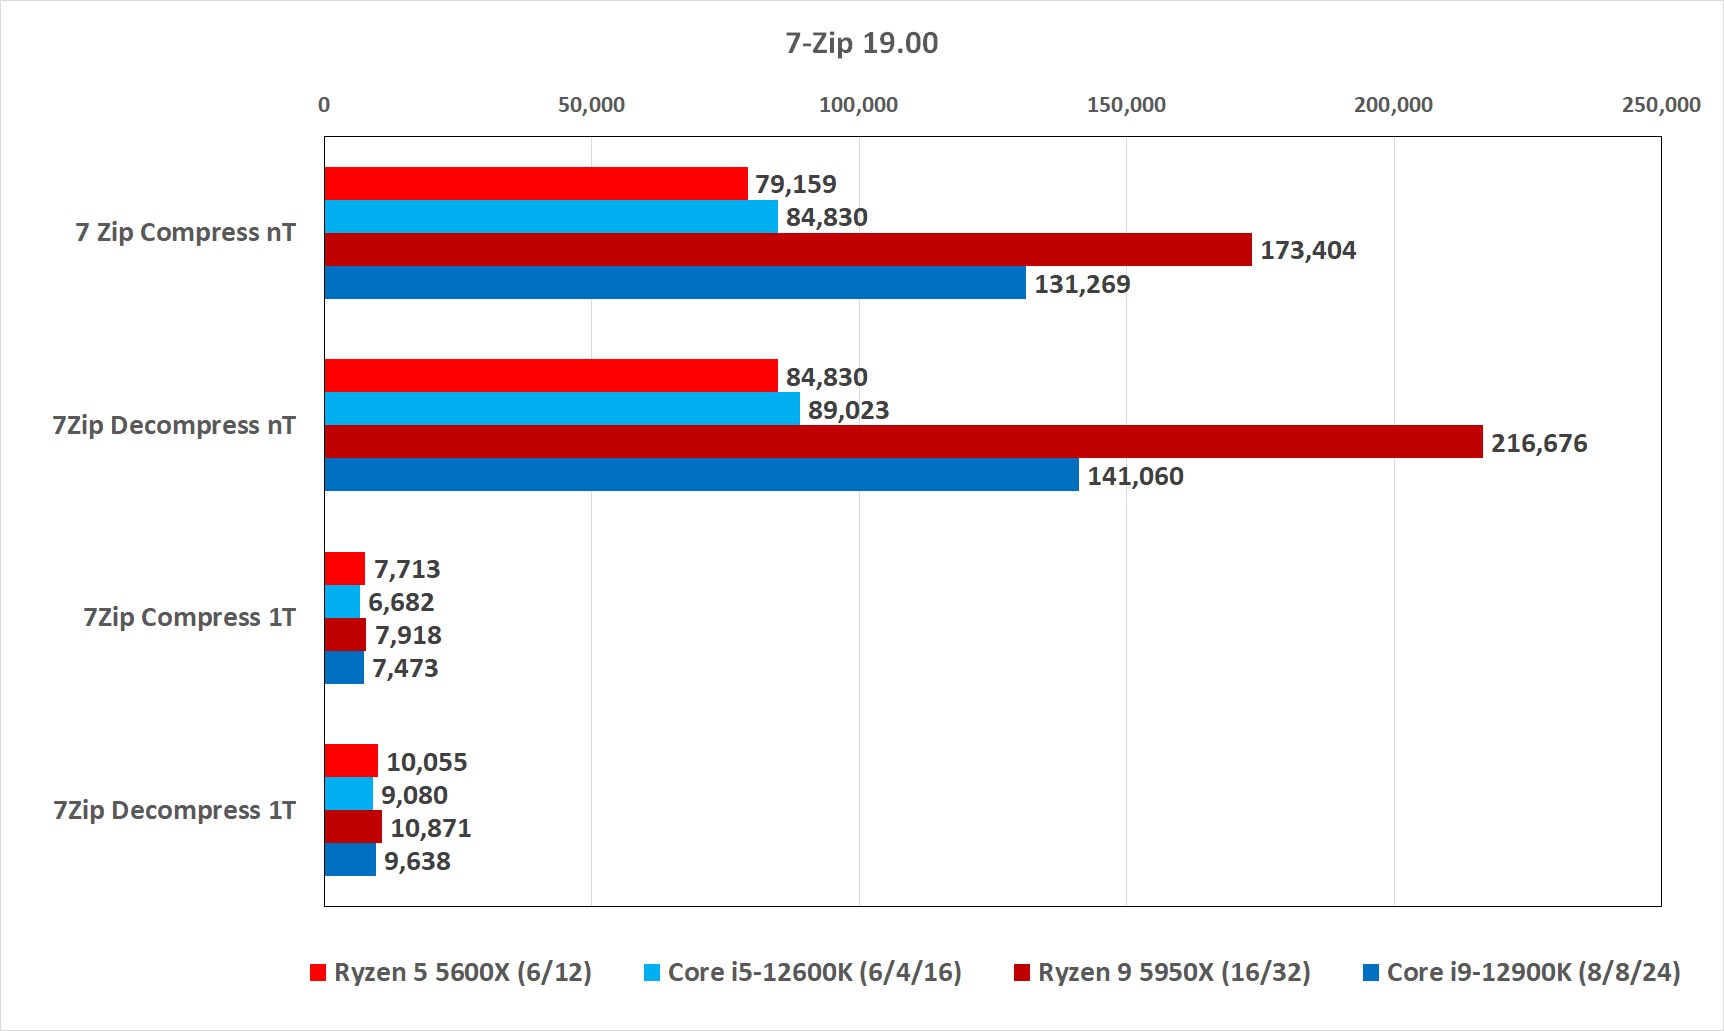
Moving on to the exhilarating world of compressing and decompressing your files, we use 7-Zip’s built-in benchmark to gauge that performance. 7-Zip is free, wonderful, and we recommend you check it out, but its built in benchmark is mostly academic since we’ve never seen it use all 16 threads of a CPU to compress or decompress a file. If you did, however, the winner would be the Core i5-12600K, which pulls in a 7 percent advantage in decompression performance and 5 percent in compression performance over the Ryzen 5 5600X.
We suspect 7-Zip either is sensitive to the latency of DDR5 or simply isn’t optimized for Alder Lake though because the single-threaded performance provides the first glimpse of a task where Ryzen is faster. We see the 12th-gen Core i5 is actually 13 percent slower in single-threaded compression and 10 percent slower in single-threaded decompression. So if your idea of a good time is compressing or decompressing files with 7-Zip, reach for Ryzen.

IDG
Encoding performance
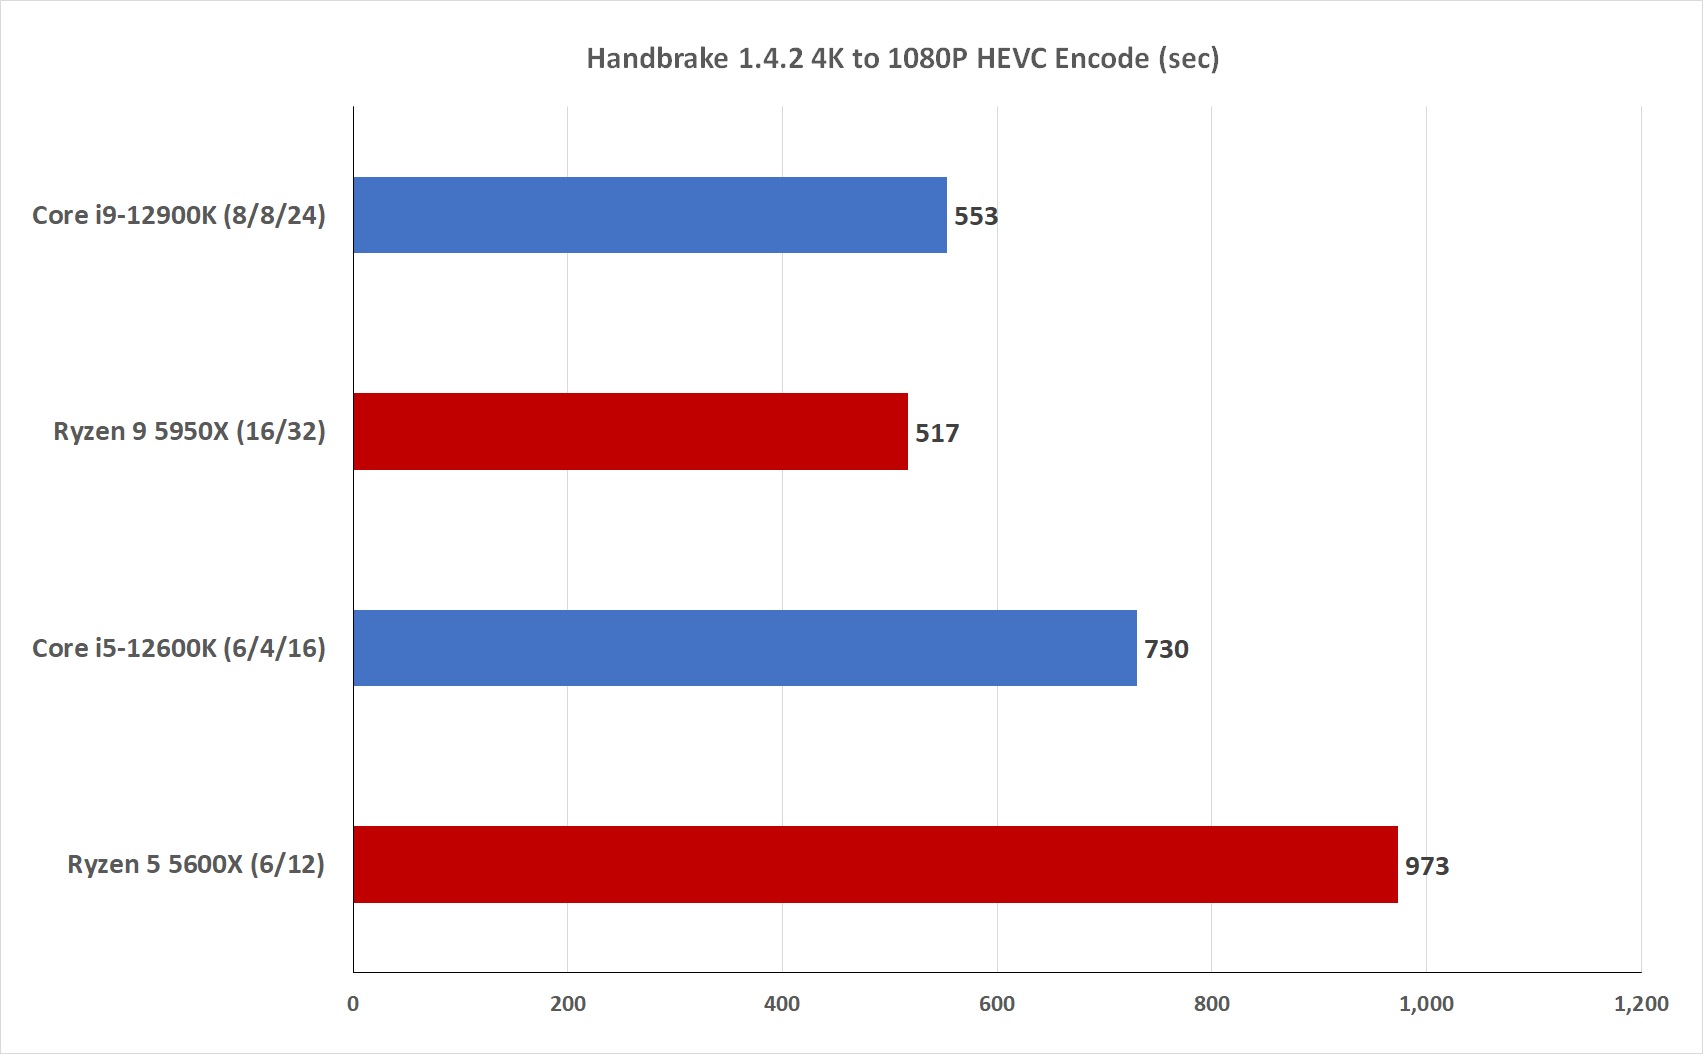
Handbrake is another great free program if you deal with converting video files on your computer. Again, while flagship Core i9-12900K has just enough juice to beat AMD’s flagship Ryzen 9 5950X, the 12th-gen Core i5 has no problems eating the Ryzen 5’s lunch. It finished our file transcode in a whopping 25 percent less time than the Ryzen 5.

IDG
Synthetic benchmark performance
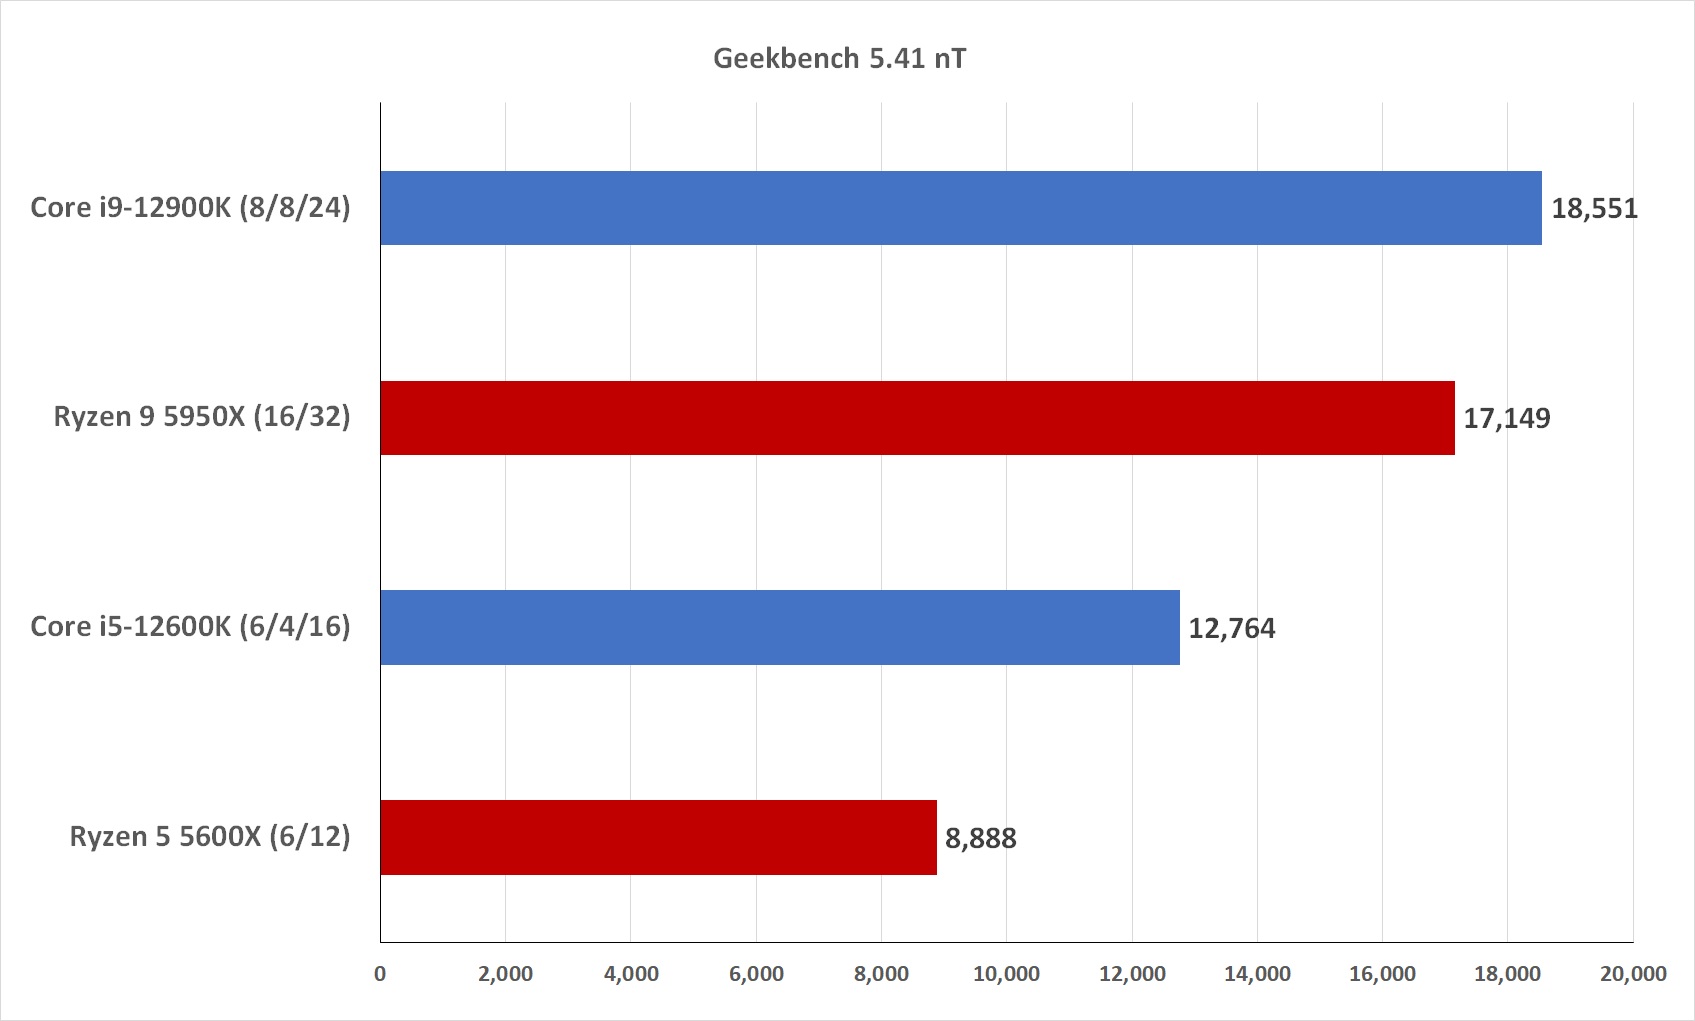
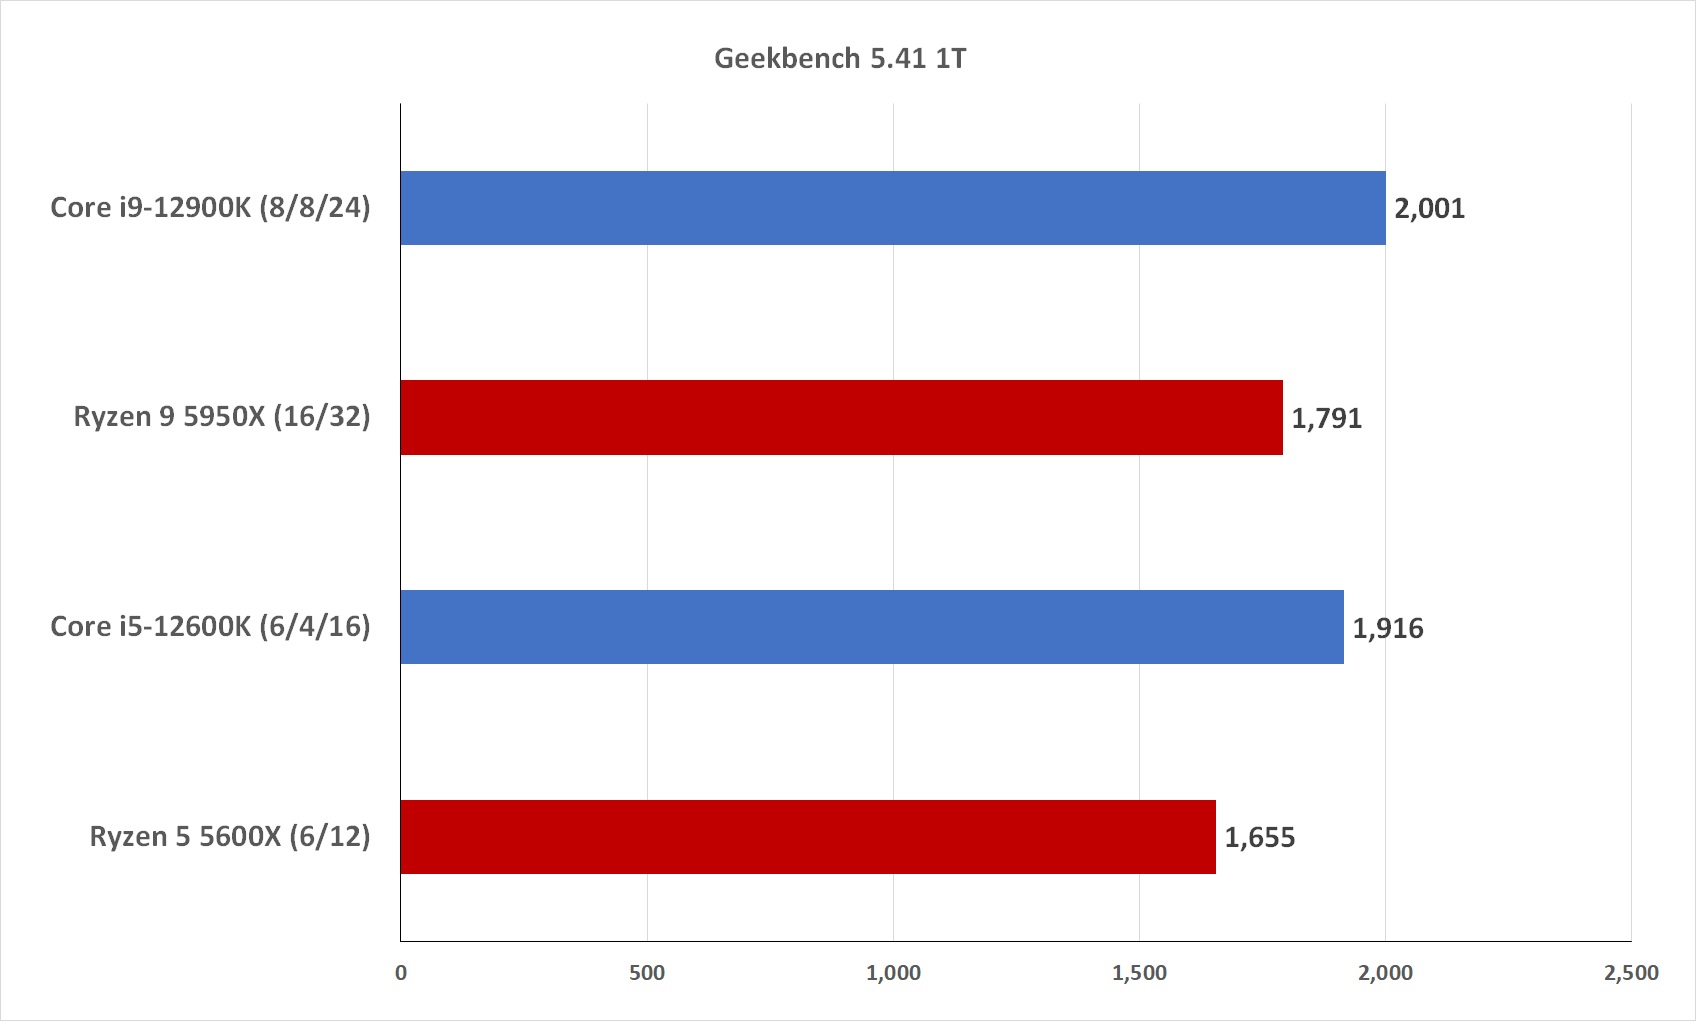
We call this category synthetic benchmark performance, but it’s really a benchmark for Twitter and Reddit, because Geekbench is apparently the benchmark of choice for people to accidentally leak a new CPUs performance. It’s come a long way from its early days, but Geekbench 5 uses an assortment of small program “loops” modeled on use cases such as HDR, ray tracing, encryption, and text rendering to gauge a CPU’s performance. The Ryzen 5 5600X is again dealt another crushing, crushing blow in Geekbench 5, with the Core i5-12600K coming in 44 percent faster than it.

IDG
As we’ve said, many applications don’t really use all those CPU cores in modern processors, but Geekbench also offers a single-thread benchmark. Intel remains in command here too, with a 16 percent advantage over the Ryzen 5 5600X. (And yes, Mac M1 Pro fans, the new Core i5-12600K is faster than your new shiny new chip too.)

IDG
Content creation performance
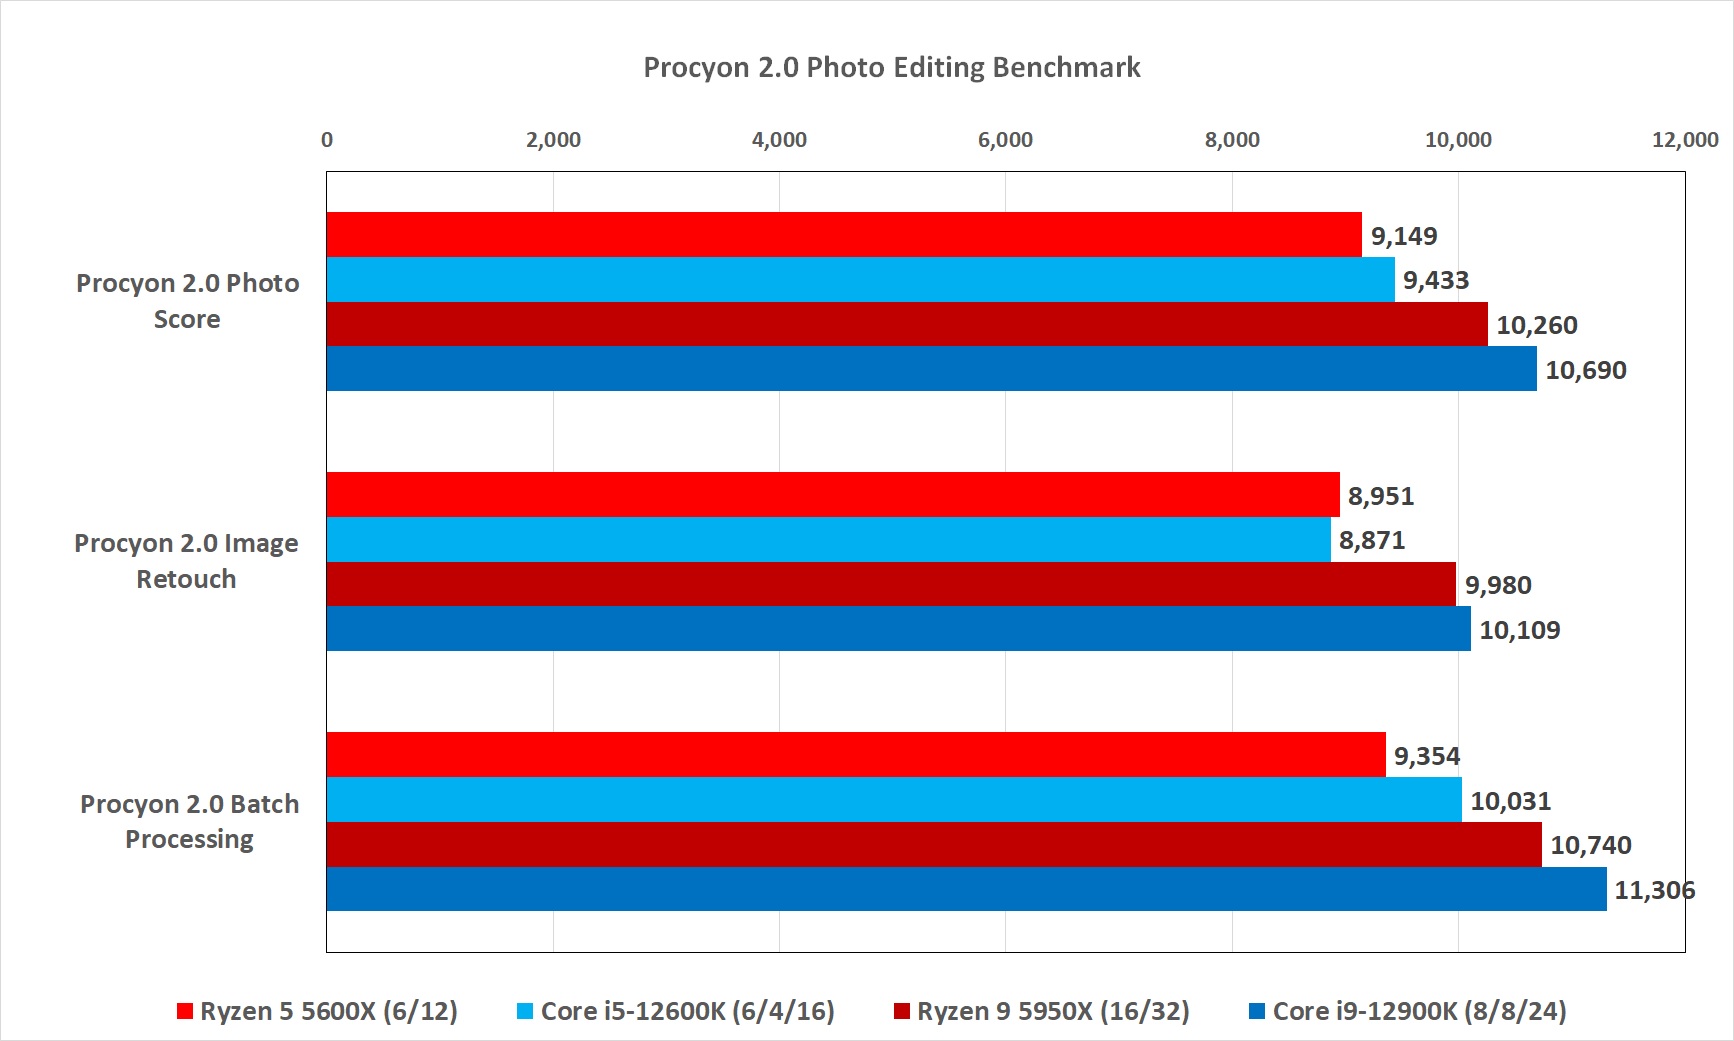
Geekbench is fun to shriek at people about on Twitter, but for something closer to reality we like to look at how fast the CPUs run actual applications, so first up is Procyon 2.0’s Photo Editing benchmark. The benchmark scripts Adobe Photoshop and Lightroom Classic with several photo tasks. Procyon 2.0’s overall score sees both chips actually close up a little, but the Core i5-12600K still edges the Ryzen 5 5600X by three percent. Looking at the sub scores, we basically see a tie within the margin of error for the Image Retouch test, which is mostly Photoshop editing performance.
In the batch processing task that leans more on Lightroom Classic performance, the 12th-gen Core i5 opens its lead to 7 percent. That doesn’t surprise us, as Lightoom Classic tends to use more CPU cores than Photoshop.

IDG
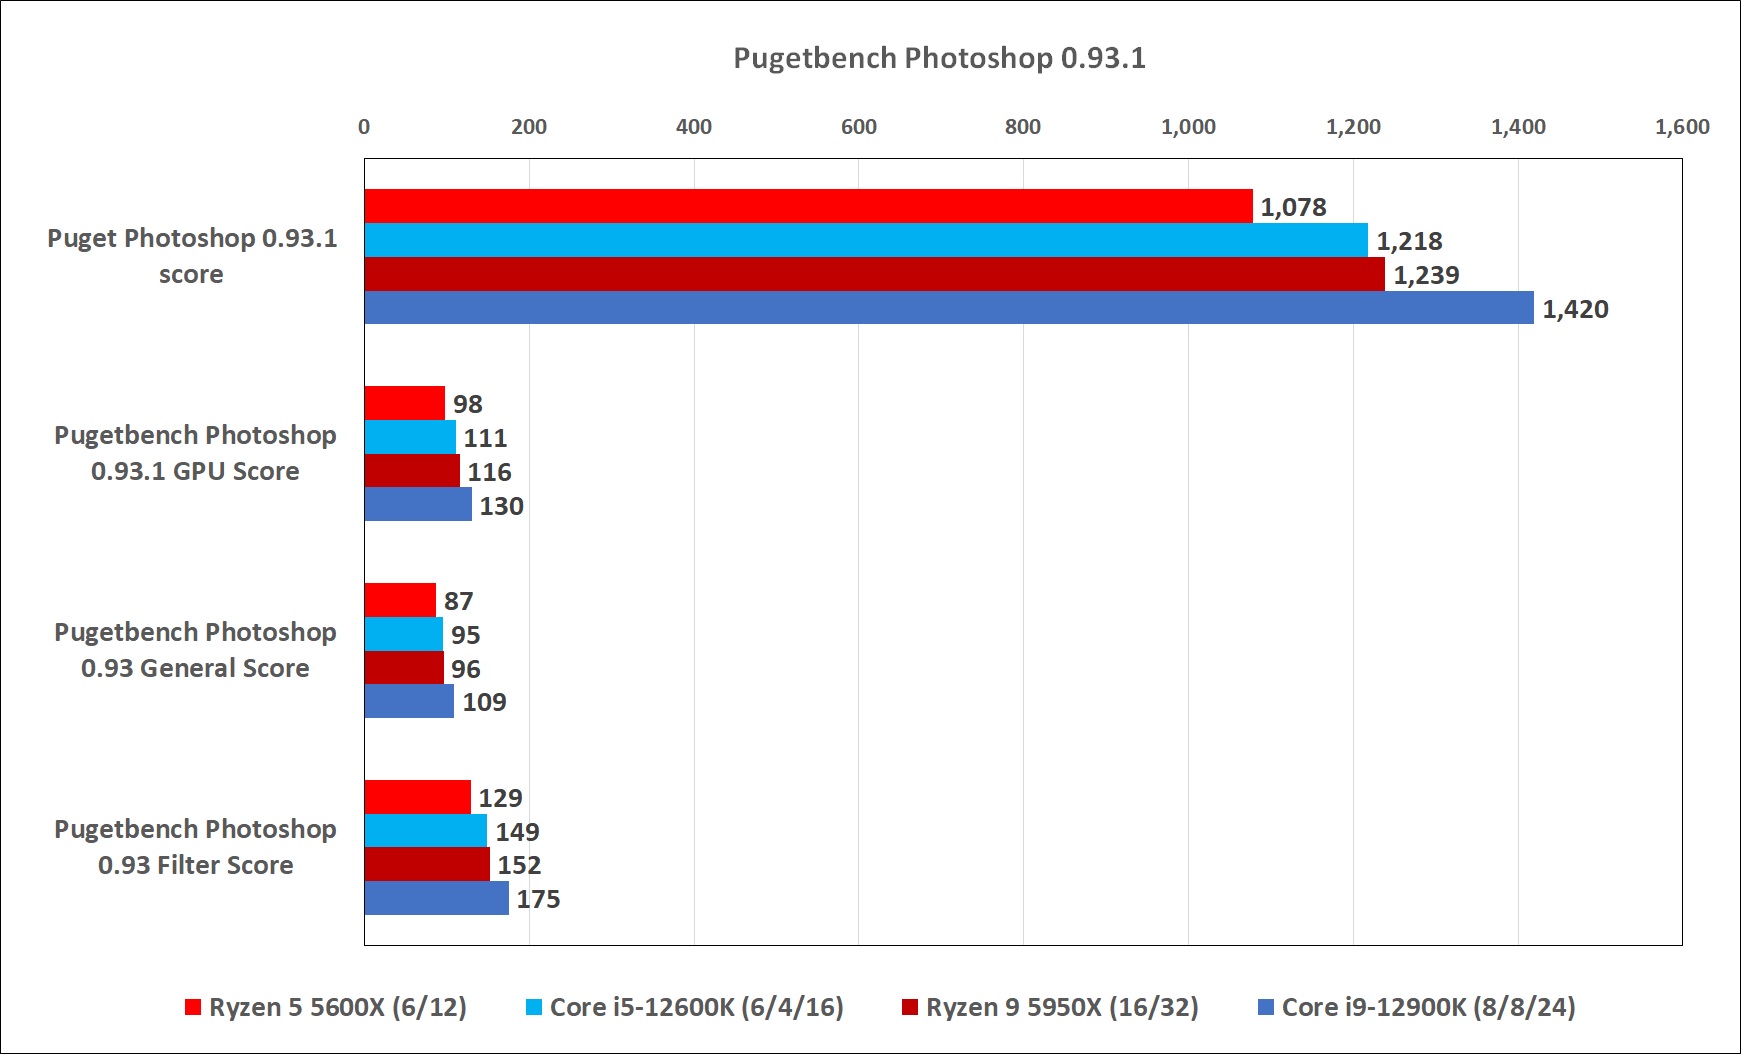
One thing you should know about sprawling applications with millions of lines of code is there is no one simple answer. One action in Photoshop might be faster than another. To address that, we backstop our results with Puget System’s Pugetbench for Photoshop. It’s a test the workstation maker created so it can give more accurate advice to customers who buy its systems.
In PugetBench, we see the Core i5-12600K with a healthier lead of 13 percent over the Ryzen 5 5600X, thanks to a 13 percent boost in the GPU score (yes, the same GPUs and drivers were used), a 9 percent bump for the general score, and 15.5 percent edge in the filter score.

IDG
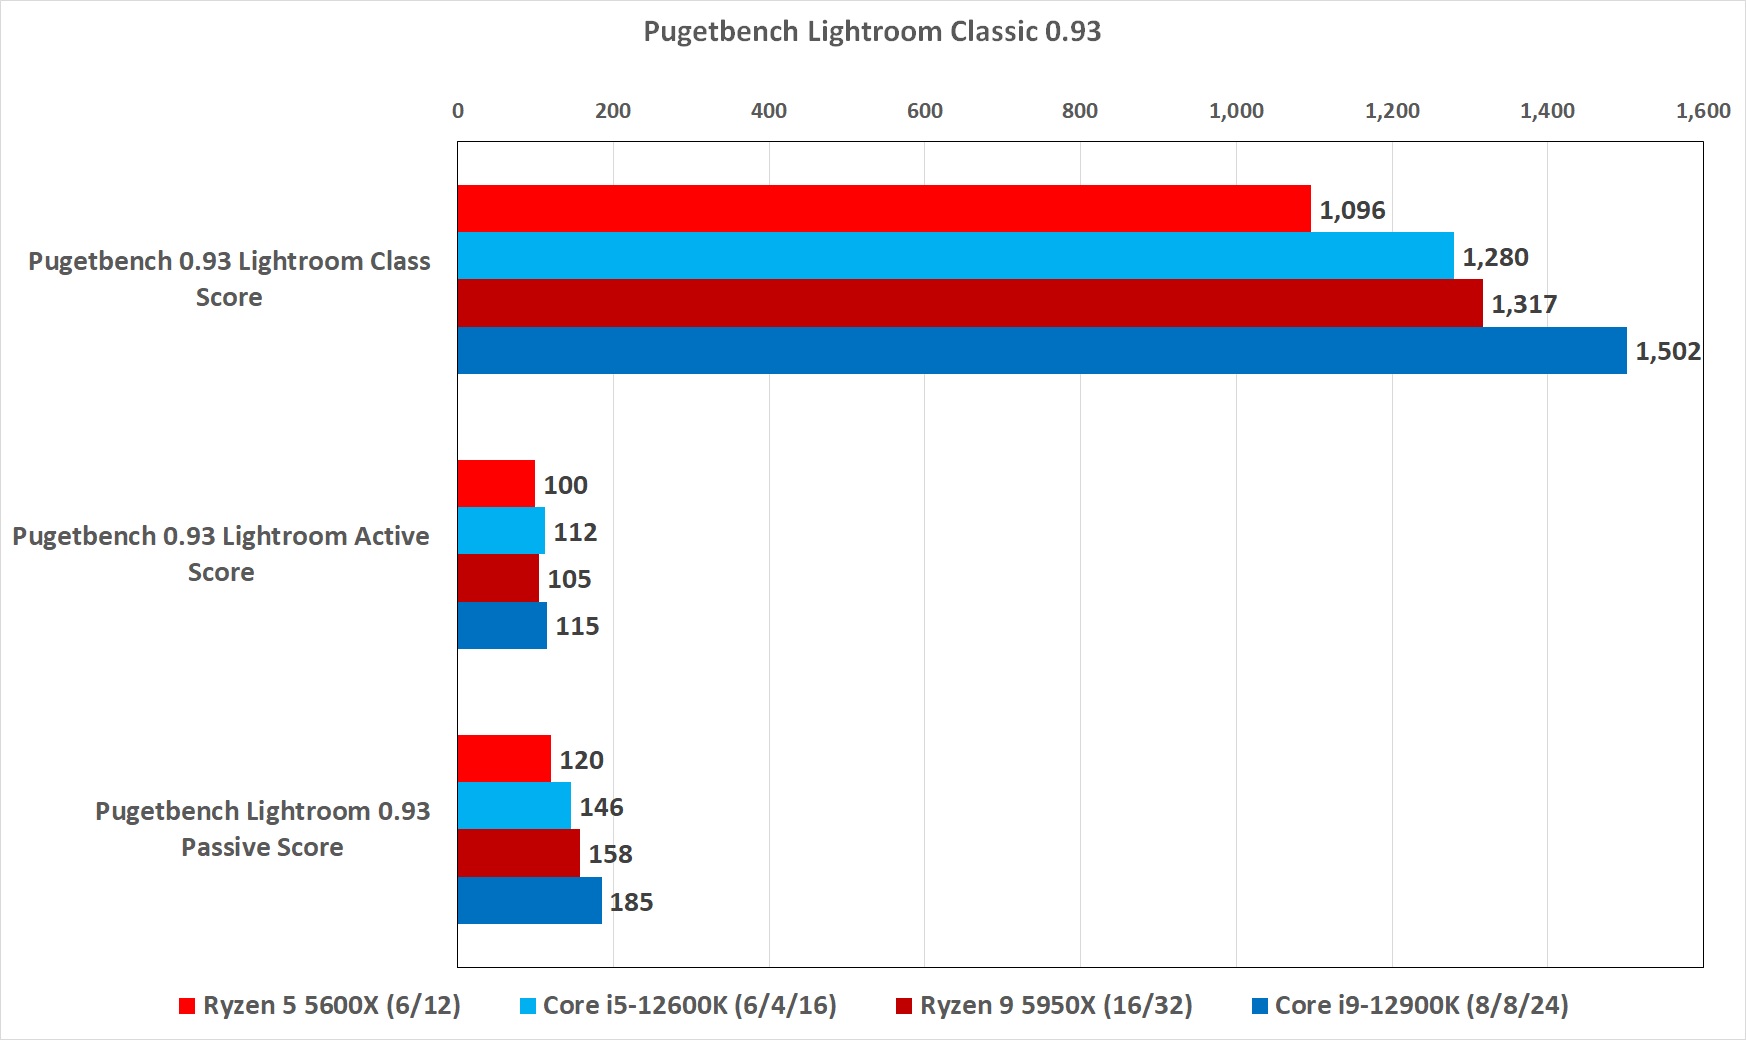
PugetBench is also available for Lightroom Classic. The 12th-gen Core i5 opens up a nice 16.8 percent overall advantage over its Ryzen rival. The scores break down to a 12 percent advantage in the active score, which refers to the general responsiveness while editing within Lightroom Classic. For the passive score, where file exports hammer more cores, the Core i5-12600K offers a strong 22 percent lead over the Ryzen 5 5600X.

IDG
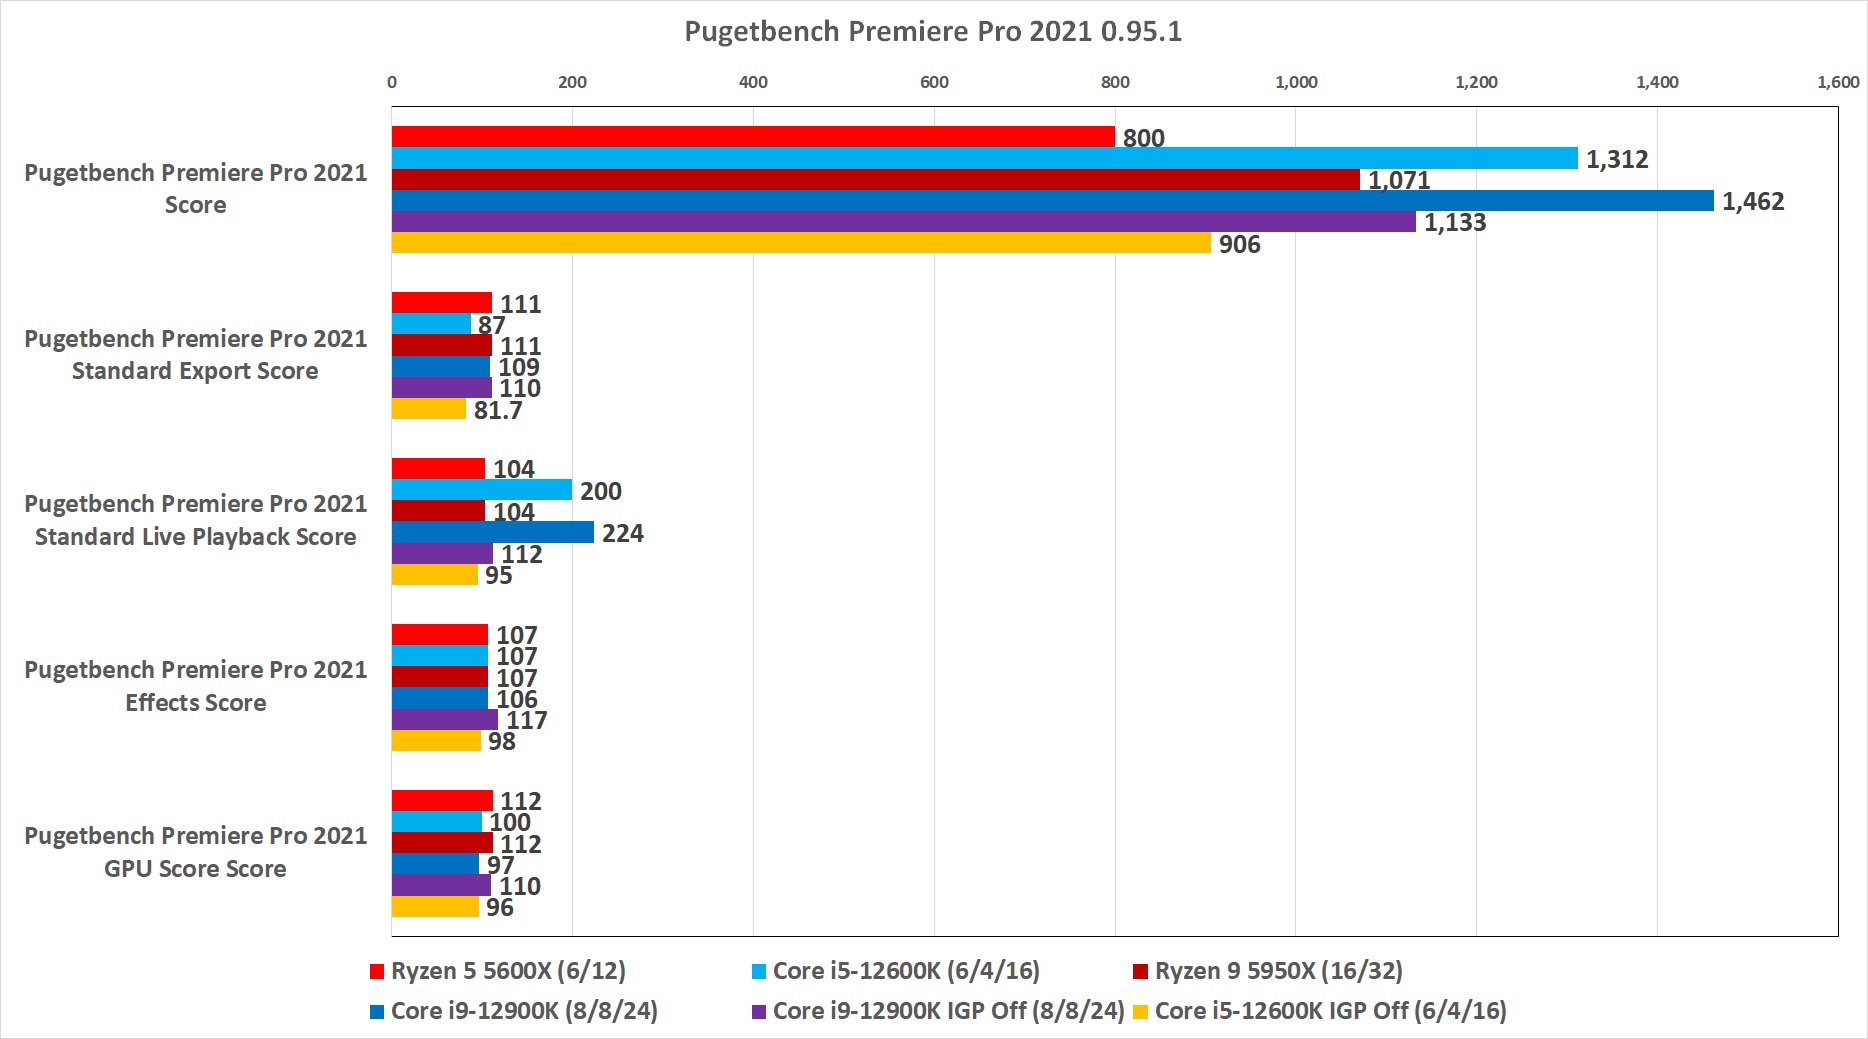
Other than photo editing, video editing can be one of the most demanding tasks on a PC. To gauge performance there, we use Pugetbench for Premiere Pro, which measures performance in the popular video editor. Premiere Pro, unlike Photoshop, can use far more CPU cores. The overall score for PugetBench gives a downright shocking 64 percent performance lead to the Core i5-12600K over the Ryzen 5 5600X—but there’s more nuance to it.
Much of the advantage—which is indeed real—comes from the live playback score, where the 12th-gen Core i5 has a 92 percent advantage over the Ryzen 5. That lead seems to come largely from the integrated graphics cores in the Intel CPU. AMD’s Ryzen CPUs don’t ship with integrated graphics. Pugetbench actually gives the edge to the Ryzen 5 5600X in the export score by a commanding 21 percent. It’s basically a tie while applying filter effects.
Which is more important? We’ve heard both sides. Some say they want faster file exports, so the Ryzen might be a little faster, while others say they want the most performance while actually driving Premiere Pro because that’s when they feel it. In the end, we’d probably agree and take the 12600K’s faster playback performance over a decent, but not huge lead in file exports.

IDG
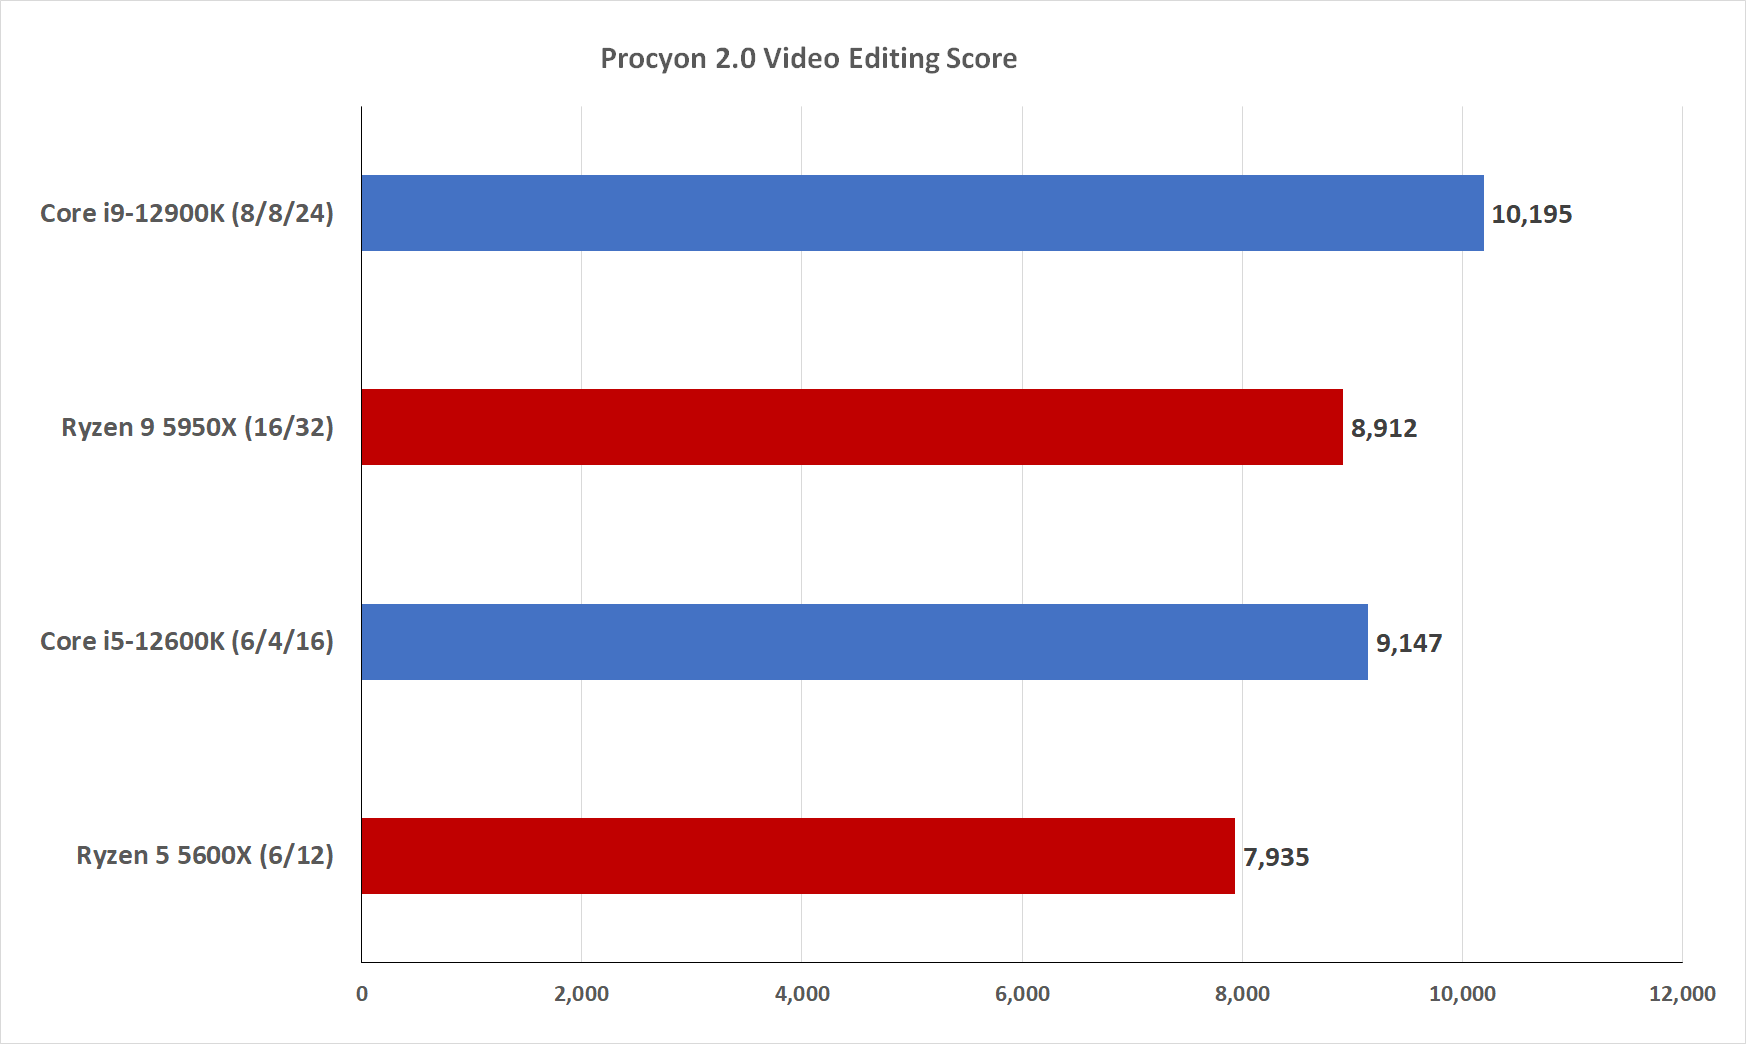
As we said earlier, the specifics of what you do in sprawling application suite as rich as Adobe Creative Cloud can sometimes can change the performance, so we also backstop our Pugetbench performance tests with UL’s Procyon 2.0 Video Editing test. Like Pugetbench, Procyon measures Premiere Pro performance by exporting four different videos from a timeline with various effects added, such as Lumitri Color adjustments. While PugetBench actually gives higher performance to the Ryzen 5 5600X, in Procyon 2.0 the Core i5-12600K has a 15 percent advantage.

IDG
AI performance
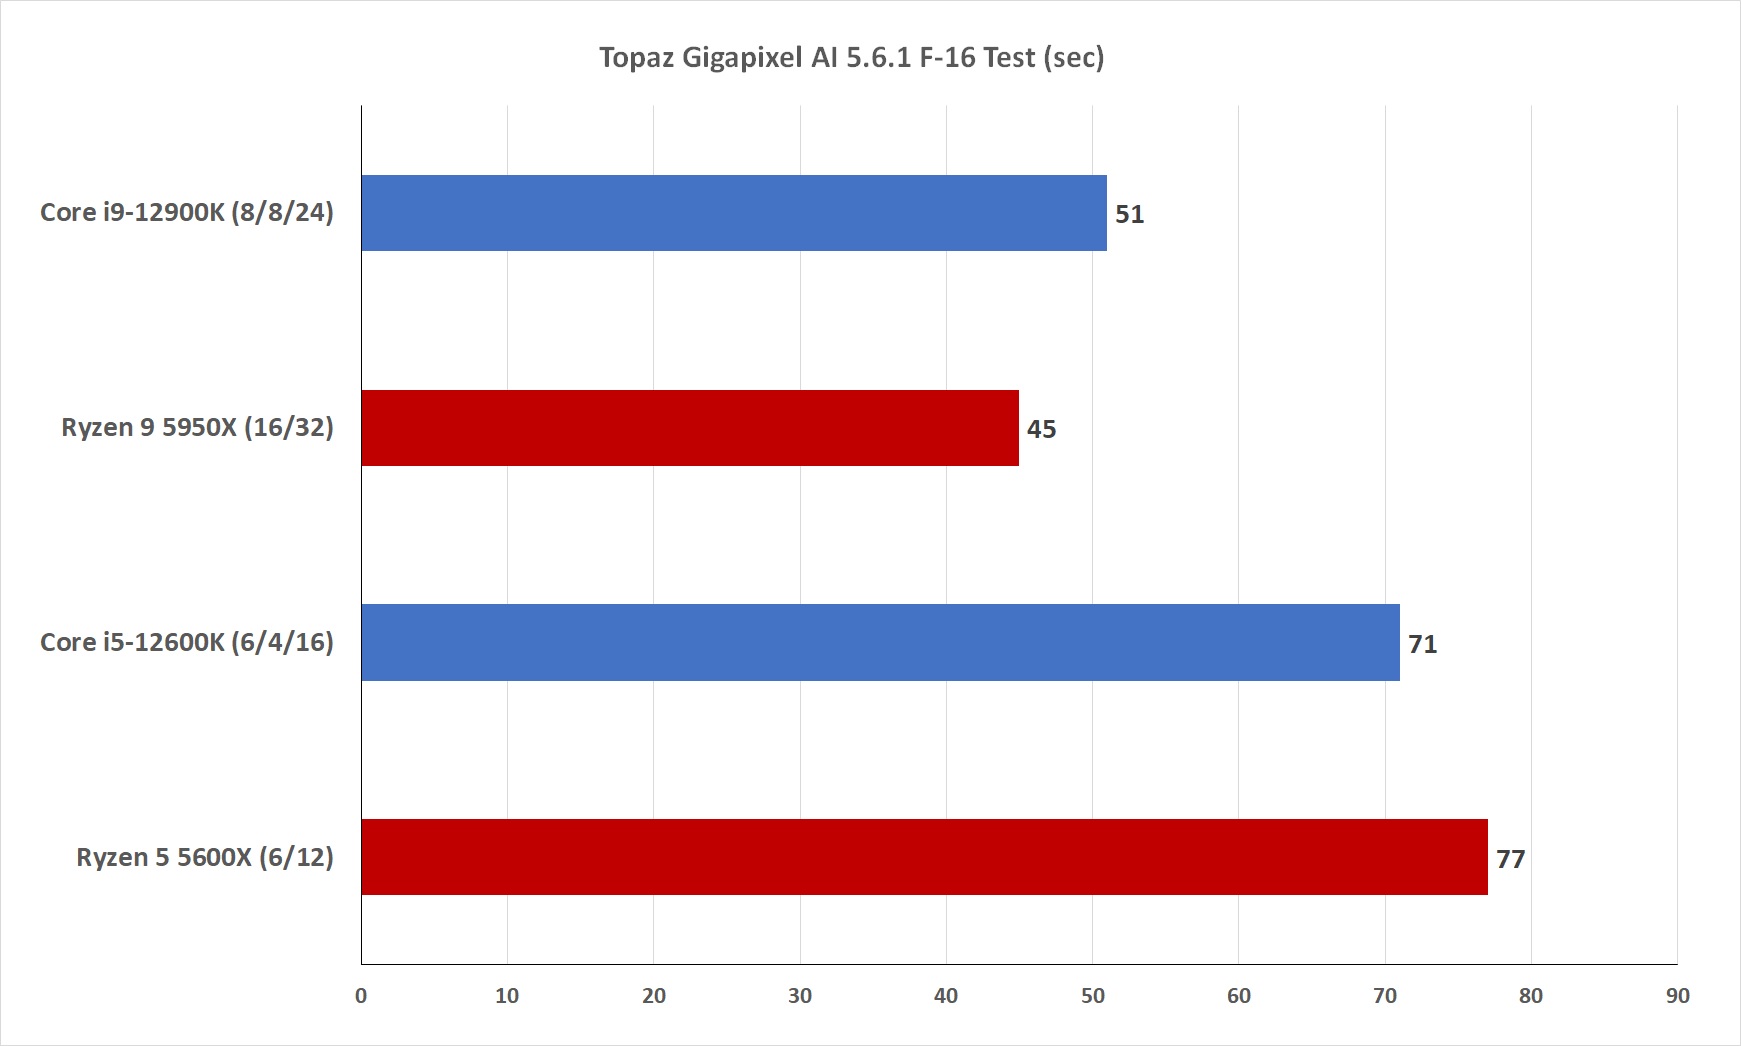
To look at the brave new world of AI performance on desktop PCs, we use Topaz Lab’s Gigapixel AI. It’s an application that uses AI to more intelligently increase the resolution of photos over simpler algorithms. For that we task Gigapixel AI with increasing the photo of an F-16 Falcon shot on an 8.2 megapixel camera a decade ago by 6x. It’s an entirely realistic use case and something that Intel has traditionally cleaned both AMD and Apple’s clocks on. We time the duration it takes to run the enlargement three times. Although Ryzen 9 actually pulls of the Core i9, that’s not the story with the more mainstream chips, as the Core i5-12600K finished the enlargement about 8 percent faster than Ryzen 5.

IDG
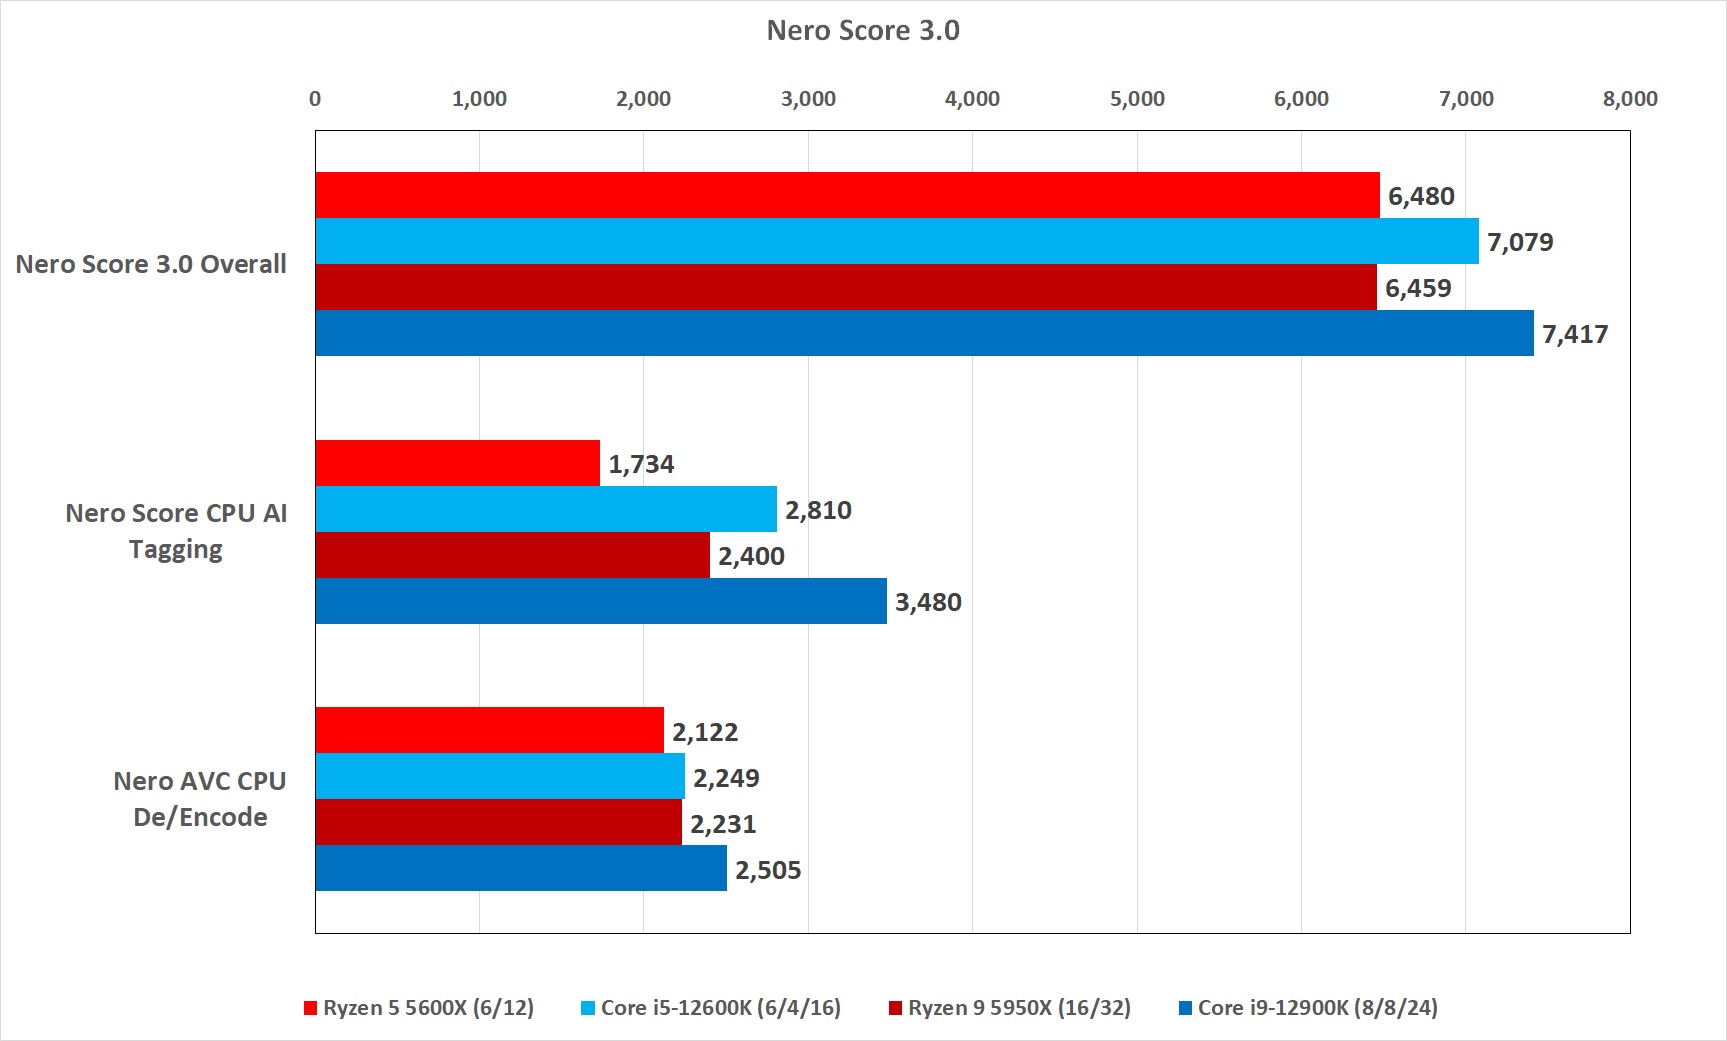
Our second AI performance test uses Nero’s Score 3.0, which looks at how fast the CPU is at analyzing and tagging photos. The test also includes AVC CPU-based encode/decode and overall scores, but we’re interested in the AI performance. That gives the 12th-gen Core i5 a crushing 62 percent advantage over its rival Ryzen 5 in AI-based photo tagging. We’re not that shocked as Intel has pushed AI using its DL Boost components for years now. Nero’s photo tagging is also built on Intel’s OpenVINO so it’s home field advantage for the Core i5. Still, AI-based image recognition manipulation has a bright future on the PC so this is nothing to ignore.

IDG
Office productivity
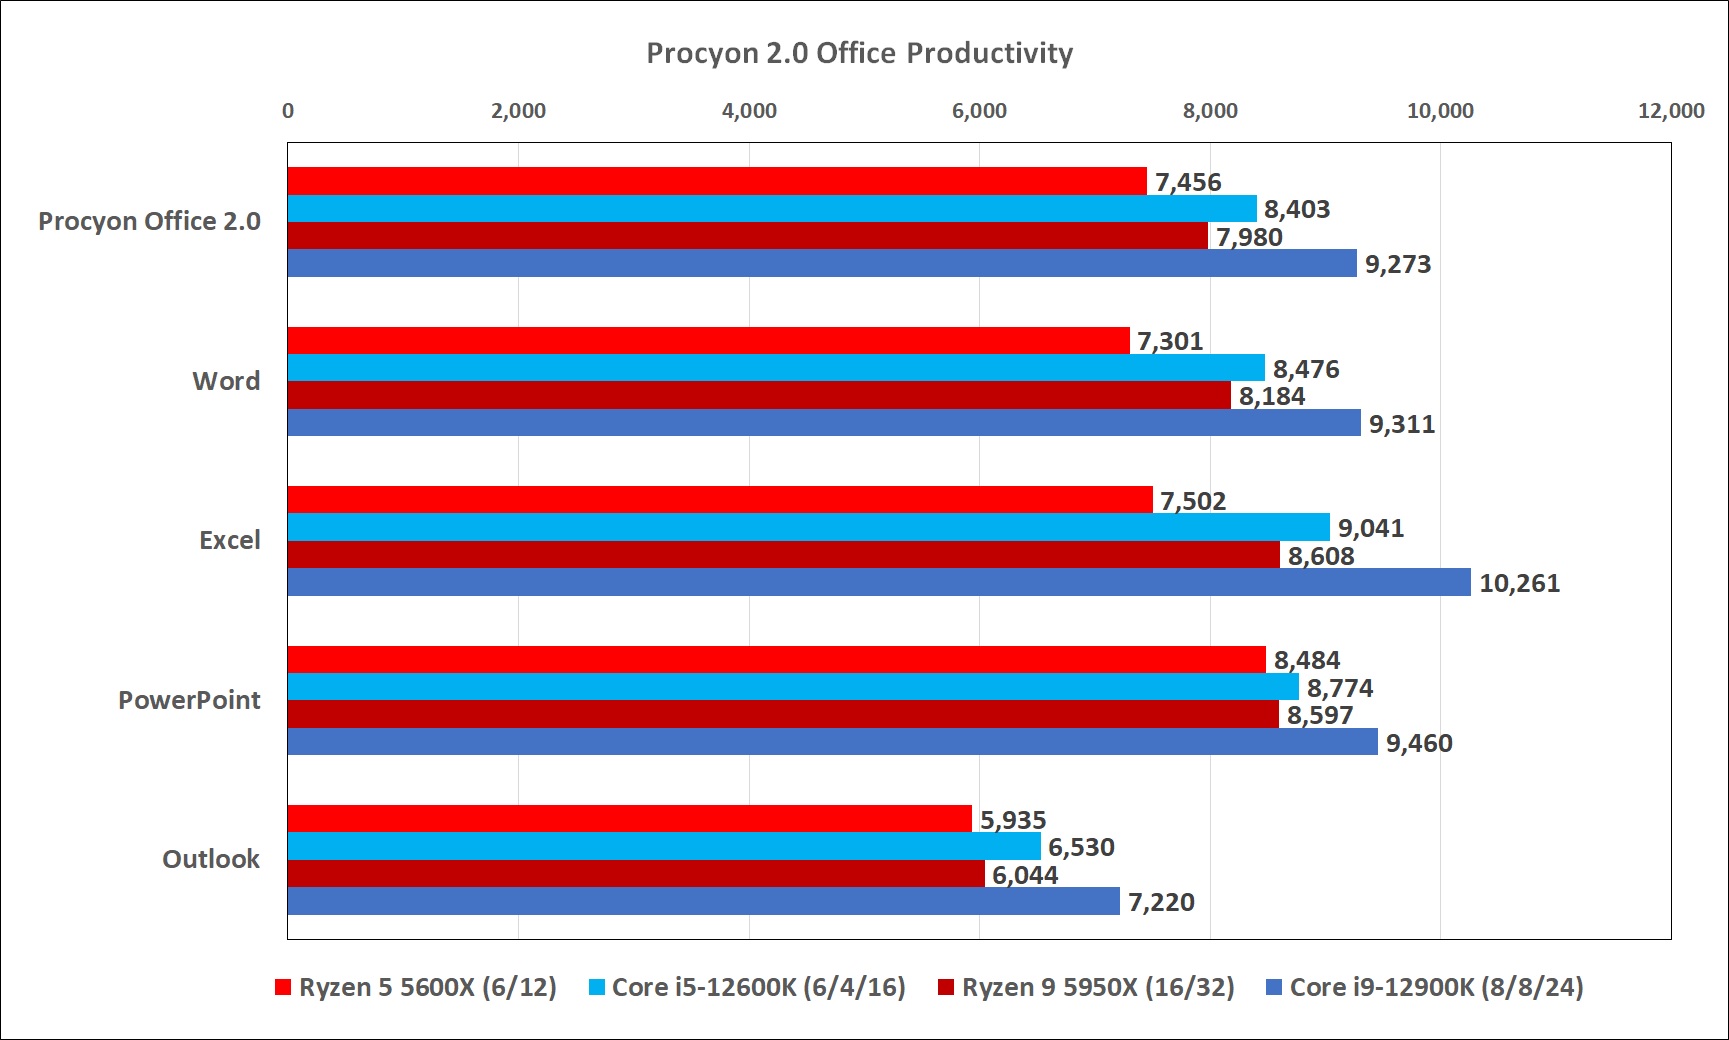
All of the video editing, photo editing and 3D rendering is sexy and fun, but you know what brings home the bacon for most people? Microsoft Office. To look at Office performance, we use UL’s Procyon 2.0 Office Productivity test, which tasks Microsoft Word, Excel, PowerPoint and Outlook with a real-world, reality-based (and mind-numbingly boring) task of editing multiple documents rich with photos, art, and calculations. New to the test is multi-tasking. While the old test ran each one after another, Procyon 2.0 now runs all of the apps at the same time. They’re not all simultaneously being “typed on” since that’s unrealistic, but they’re all launched and pictures, text and other bits are copied and pasted between them—just like you would in a real-life corporate world environment.
Overall, the Core i5-12600K holds a respectable 13 percent lead over Ryzen 5 5600X. Digging into the scores, that translates to a 16 percent lead in Word, 20 percent lead in Excel, 3.4 percent in PowerPoint and somehow a 10 percent advantage in Outlook. So yes, if you don’t want Bill Lumberg to tell you come in on Saturday (and Sunday mmm’kay?) you probably want your next Office PC to run a 12th gen chip.

IDG
Browser performance
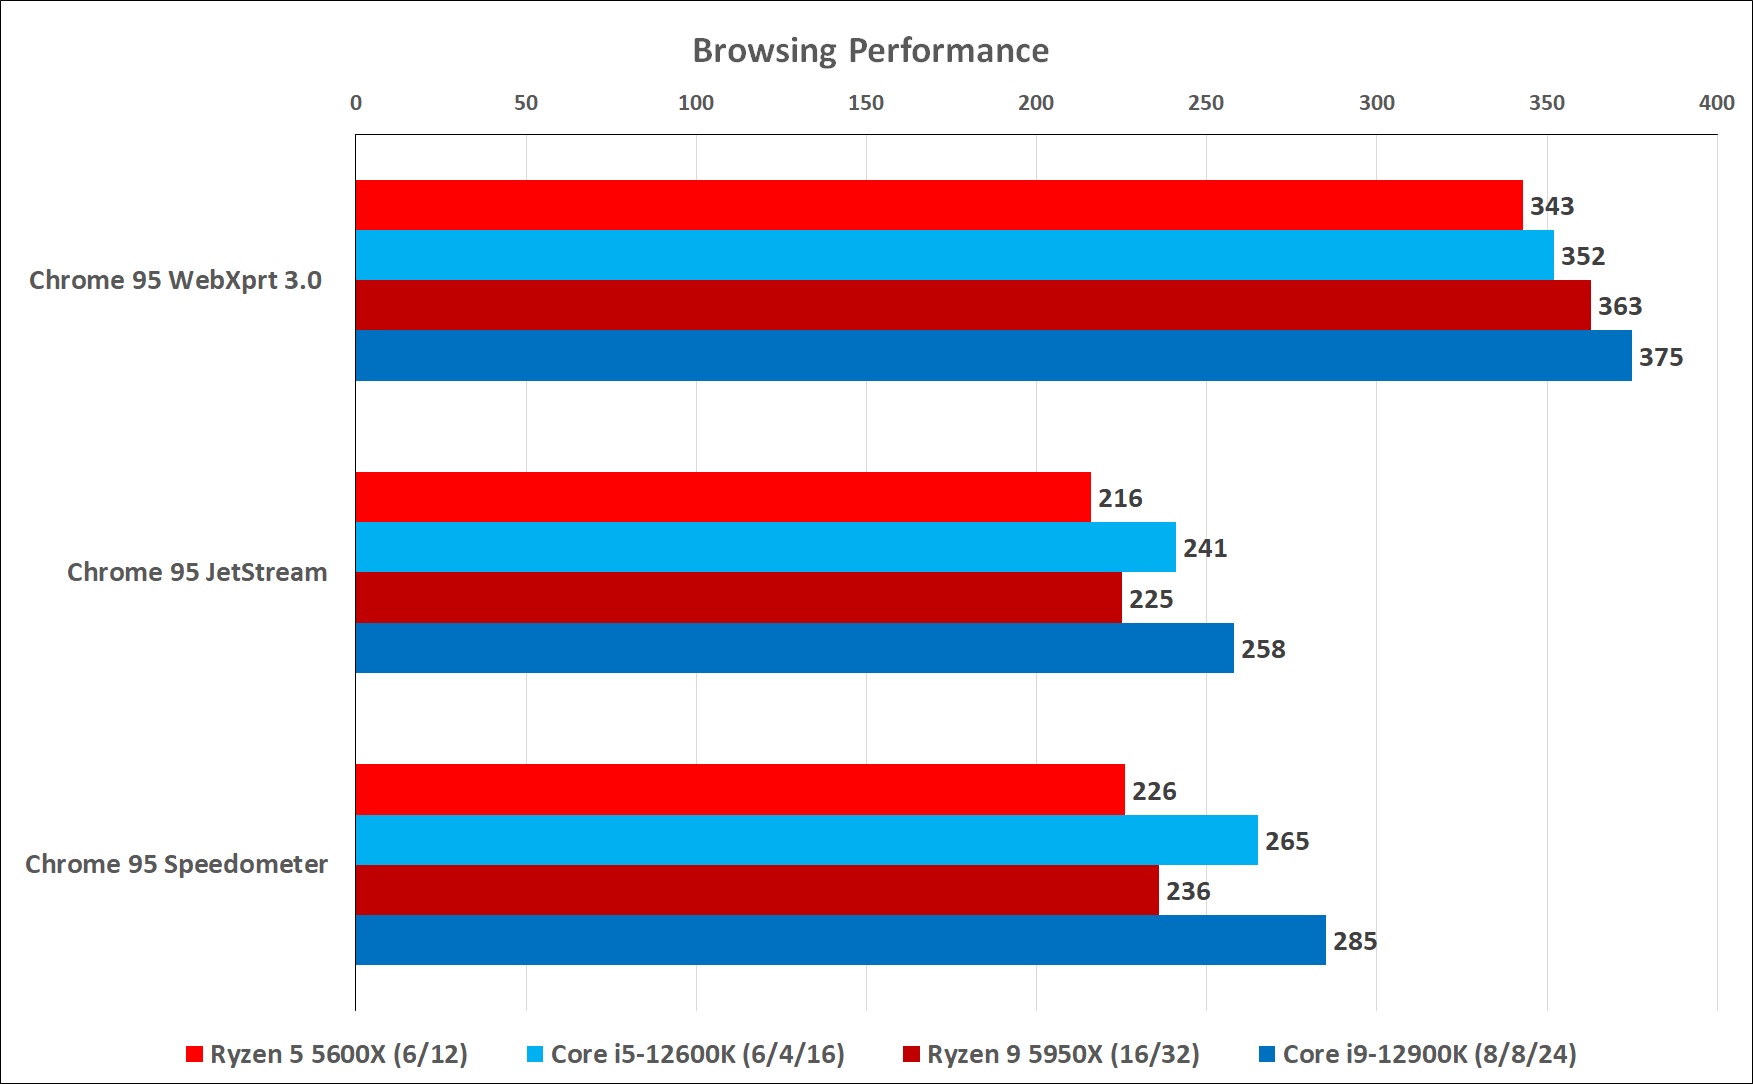
Our last tour of the Real World looks at browser performance using Google Chrome 95 and three popular browser-based benchmarks. All three are sensitive to high boost clock performance. WebXPRT 3 tries to measure browser performance across work such as such as photo enhancement, stock option pricing, online homework and an OCR scan. It’s not much to crow about but the Core i5-12600K is slightly ahead of Ryzen 5, by about 2.6 percent. In JetStream 2.0, the Core i5 opens up its lead to 11.6 percent. Finally, in Speedometer 2.0 (which is made to measure responsiveness) the Intel CPU offers up a substantial 17 percent advantage over Ryzen.

IDG
Gaming performance
The last application performance category we’ll look at is one of the most important ones, but it’s also somewhat overly emphasized: PC gaming.
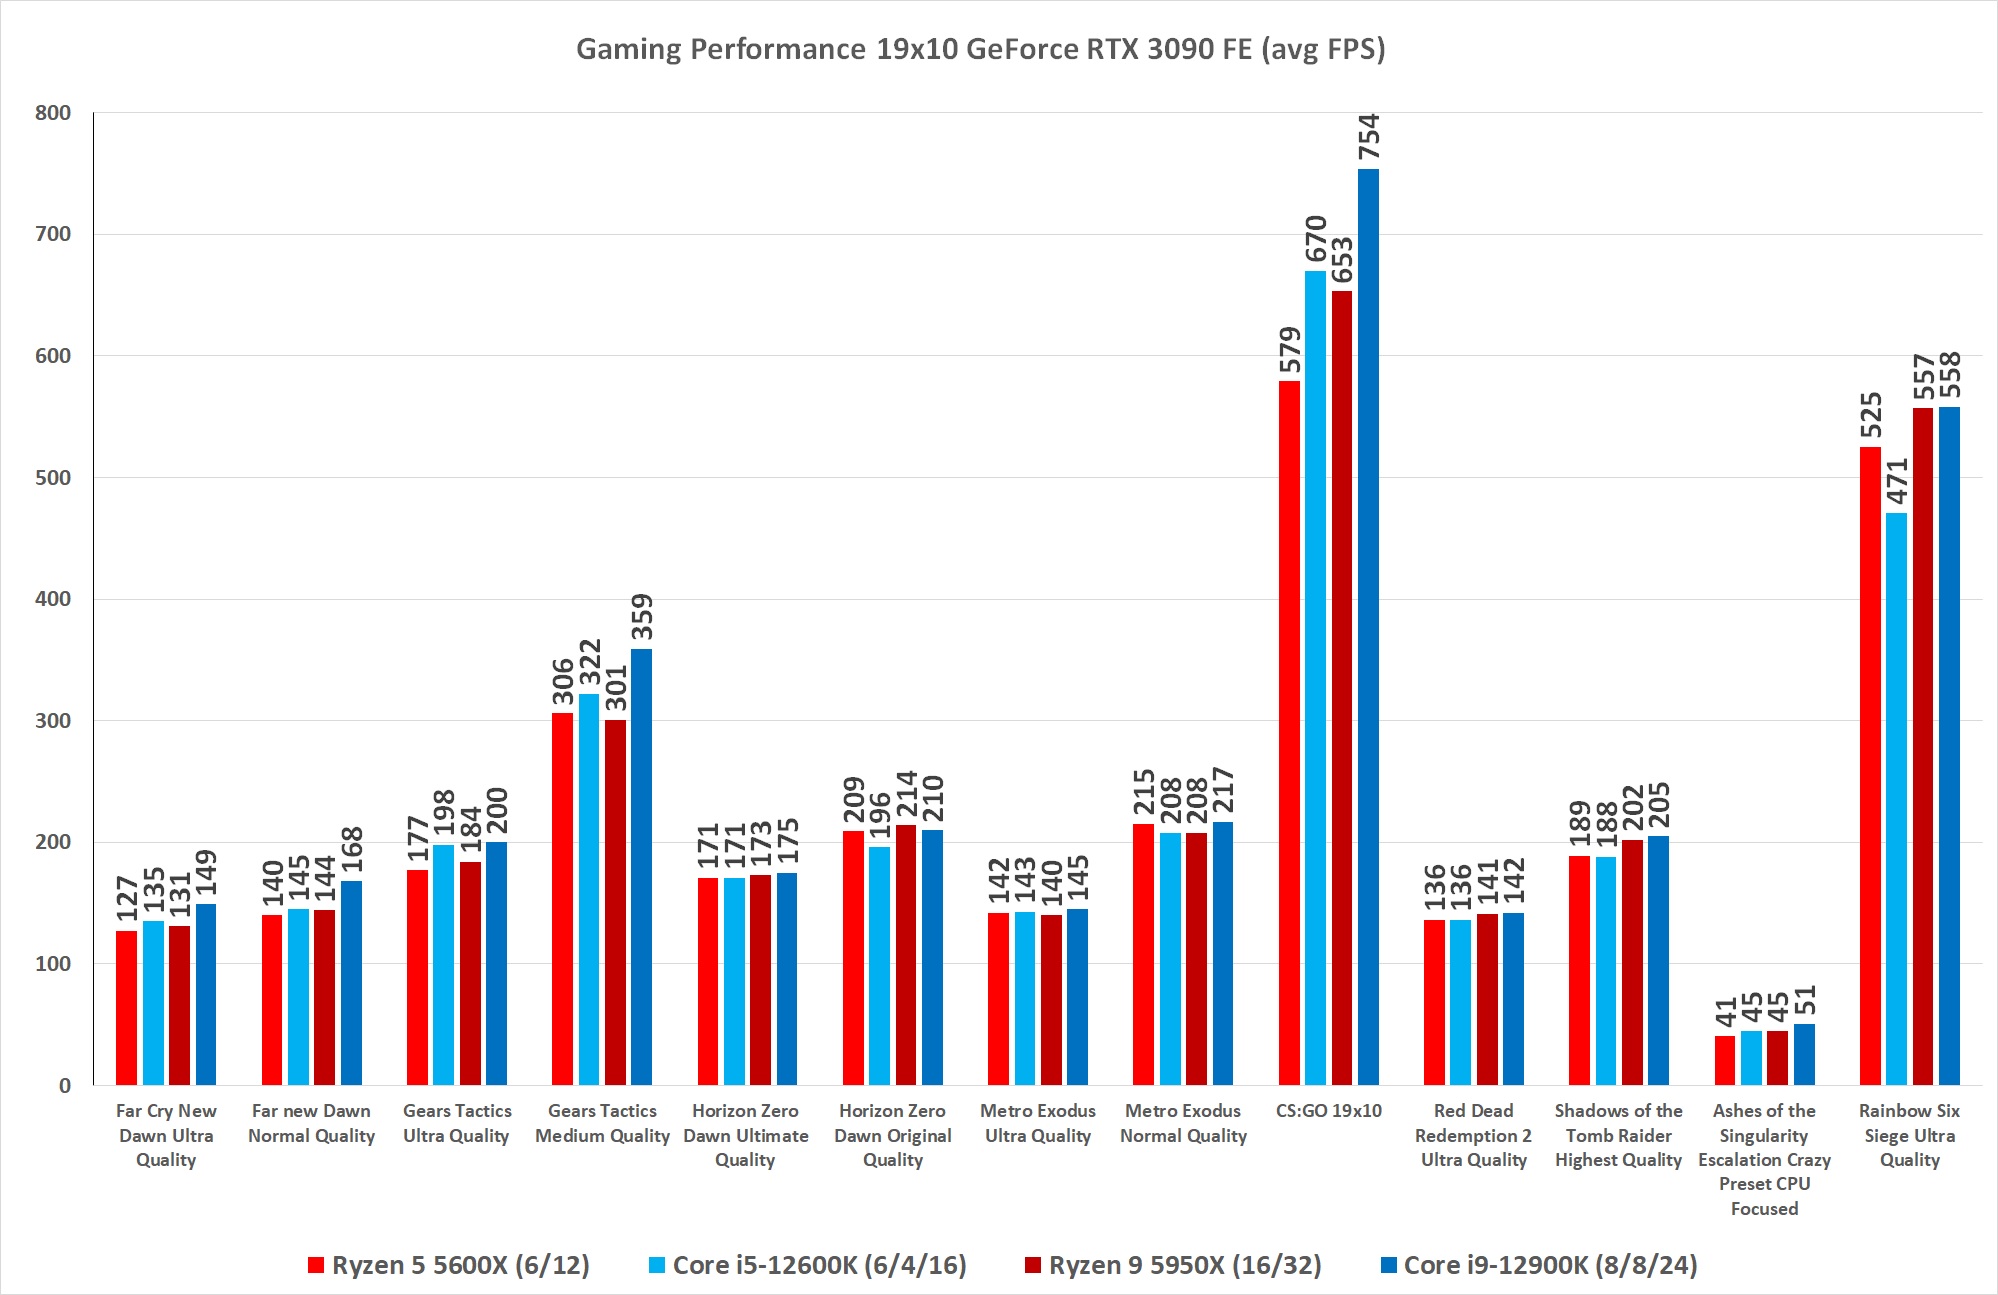
Yes, PC gaming is an immensely important factor in many computer purchases, but the role the CPU plays in it—although vital—takes a backseat to the GPU. With that said, our testing favors fast CPUs as we use a target resolution 1920×1080 on a 240Hz monitor with a GeForce RTX 3090 Founders Edition GPU. That setup puts as much load as possible on the processor. But the truth is any modern top-of-the-line AMD or Intel CPU will offer a good gaming experience when paired with a solid graphics card.
With that said, out of the eight games we ran, Intel had wins in four, with two ties and two losses. By points, that gives Intel the advantage, but some of the losses aren’t good looks, such as 10 percent lower frame rates in Rainbow Six Siege. Between these two parts, everyone wins! (But yes, the Core i5-12600K wins a little more).
There is one shoe yet to drop in this discussion, though: DDR4 vs DDR5 memory. Although DDR5 offers nearly double the bandwidth of DDR4, it comes with a higher memory latency cost. We’ll roll out DDR4 results soon (our Core i5-12600K test machine runs on DDR5) but DDR4 paired with a 12th-gen Core i5 may actually amplify Intel’s position.
Despite that, we think you should spend more time standing in line hoping to buy a faster GPU then pouring over charts hoping an extra 5.3 percent one CPU has over another is going to magically make your GeForce GTX 670 into a GeForce RTX 3070. It’s not.

IDG
Power consumption
We’ll close out with a discussion about power consumption. Even before Alder Lake launched, many people already believed that Intel’s 12th-gen chips would be a power hog. And it is—but only under an all-core load. By monitoring power consumption in most lighter applications like Photoshop, Chrome, Office and even Premiere in our 12th-gen Core i9 review, we found it’s actually far closer between the Ryzen and Core CPUs, with Intel’s flagship Core i9-12900K using less power than the Ryzen 9 5950X sometimes.
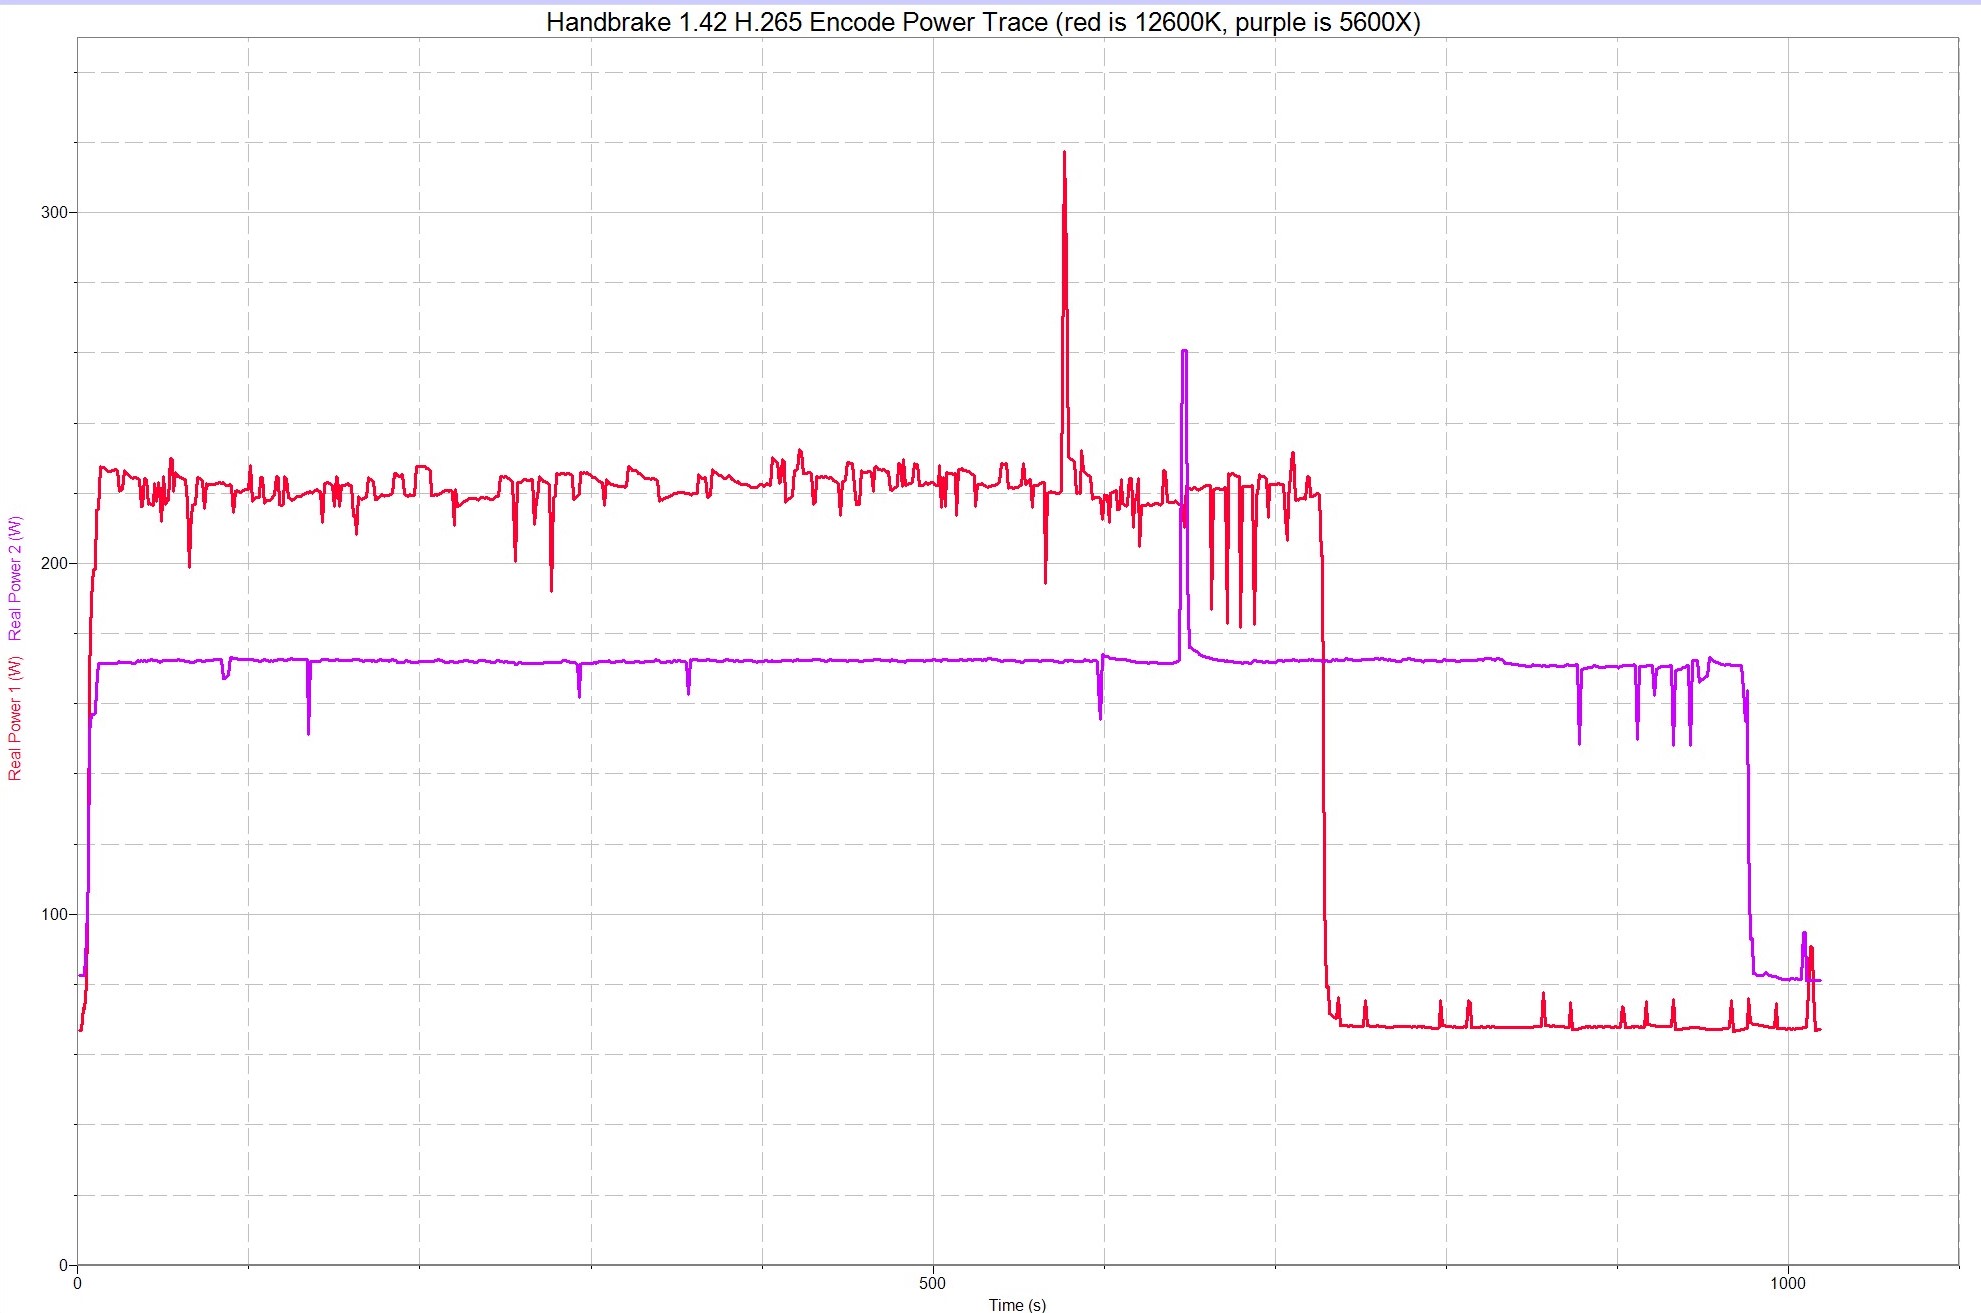
With the Core i5-12600K and Ryzen 5 5600X, that math changes. While the Core i9-12900K has an equal number of physical cores to the Ryzen 9 5950X, the Core i5-12600K actually has more physical cores. That can lead to results like what you see below in Handbrake 1.42, where we recorded total system power consumption (how you pay your electricity) on both CPUs with nearly the same components inside. As you can see, the Core i5 uses about 220 watts while running the encode while the Ryzen 5 5600X uses about 165 watts. The Core i5, however, finishes the work and begins to idle well before the AMD CPU can. Its idle power is also slightly better than the AMD CPU.

IDG
This last power trace perhaps shows the magnitude of difference between the Core i5-12600K and the Ryzen 5 5600X. It records a standard Cinebench R23 run. By default, it runs a render of a frame in a loop for around 10 minutes. If the render is still in progress when the timer hits 10 minutes, the render continues until it’s done.
In our power trace, each time the frame is rendered and Cinebench R23 restarts is shown as the power sagging for a few seconds and then spiking back up while it renders the frame.
What you see is the 12th-gen Core i5 system consuming about 220 watts during a render versus the 170 watts of the the Ryzen 5. In the same time, however, the Core i5-12600K manages to render the same frame 14 times, while the Ryzen 5 5600X can only render the frame 9 times. Holy smokes.


IDG
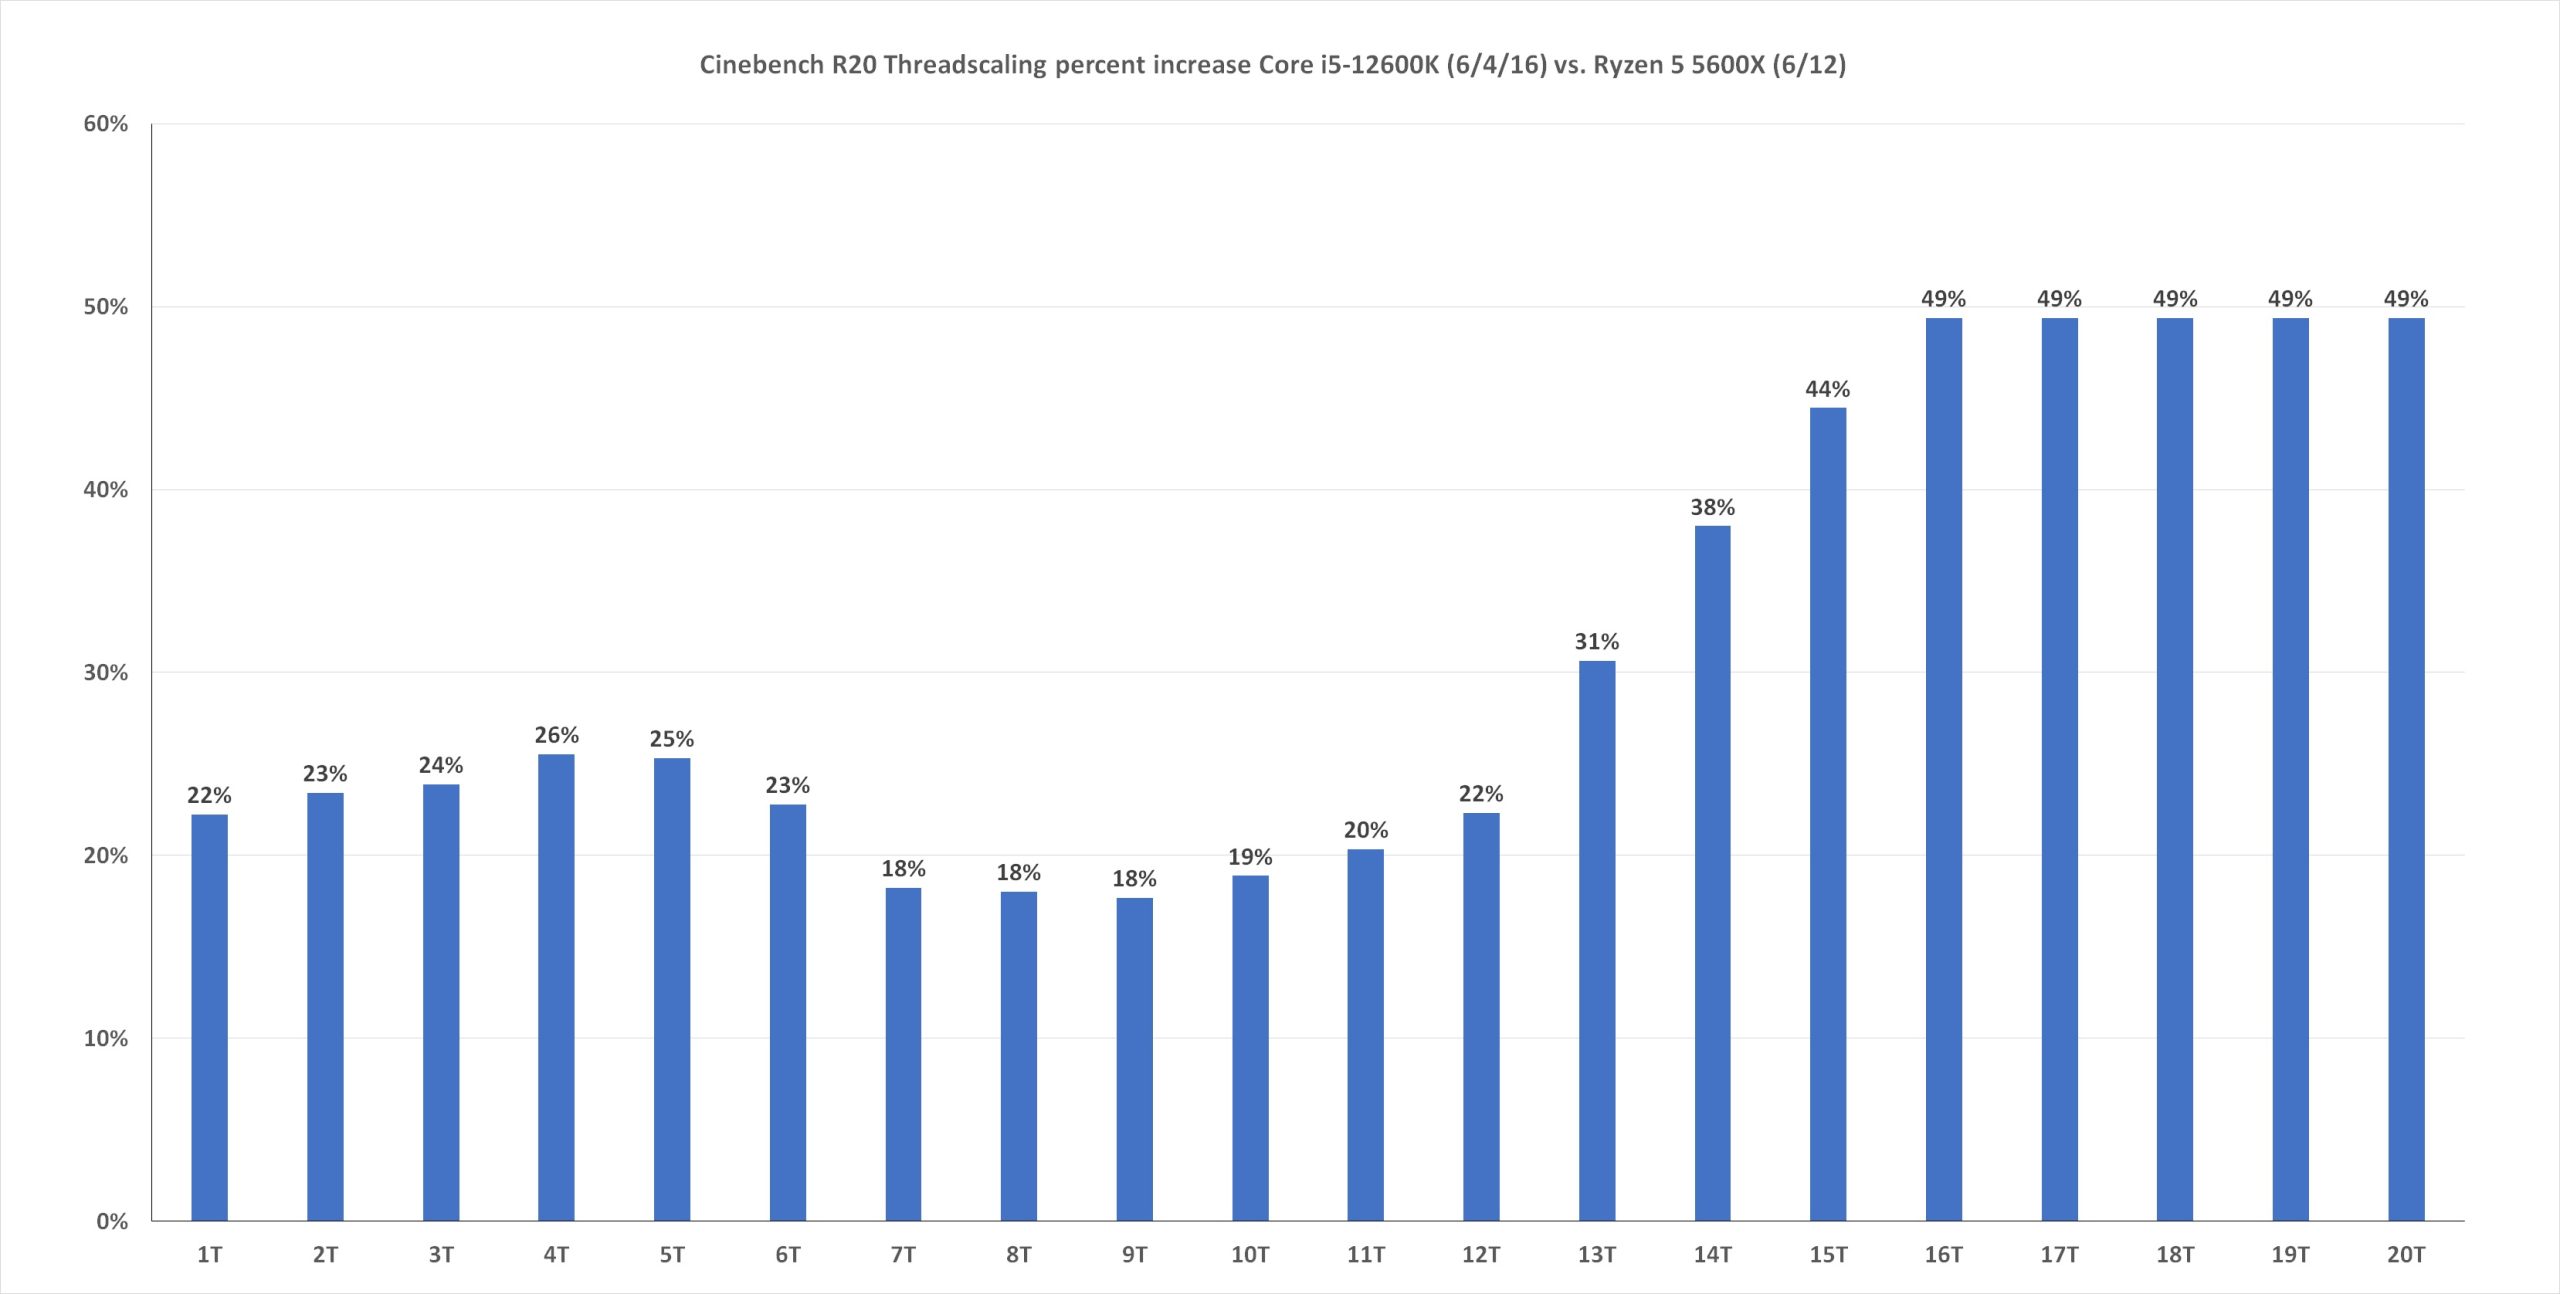
Thread scaling
We’ll close this out with a chart of Cinebench, where we run from one thread to the maximum number of threads the CPU has. The idea is to get a feel for where the chip performs based on the number of cores or threads an apps might use. Not all applications will use all cores, and not all applications will use a single thread. This provides some insight into those variables.
If you mostly use lightly threaded tasks like Photoshop, Office, or Chrome, you might favor a CPU that’s stronger in the left side of this chart. If you do a lot of core-heavy tasks such as 3D rendering or even specific financial modelling in Excel, you may want a CPU stronger on the right side of this chart.
Not that it really matters here: Intel’s 12th-gen Core i5-12600K is the winner no matter what you do. Obviously, you get your most performance on multi-core loads, but it’s the winner in almost every single thing we could run on it.

IDG
Conclusion: Put a fork in it, Ryzen 5 is done
We can’t write our conclusion without talking about price. Today, the Ryzen 5 5600X still goes for $299 to $309 on the street. Intel’s Core i5-12600K is priced at $289 in bulk quantities. Its street price will no doubt be higher initially but we want to point out that once the initial demand dies down on CPUs, they typically sell at their bulk “tray” price on the street, or even below. That means, in theory, despite offering sometimes 50 percent more performance, the 10-core Core i5-12600K could be selling for $10 less than the Ryzen 5 5600X. And if you’re willing to skip the integrated graphics, you’re potentially looking at $264 for a 10-core Core i5-12600KF chip.
That’s why we have no doubt that Intel’s Core i5-12600K isn’t just focused on beating the AMD Ryzen 5 5600X—it aims to erase it from existence. Frankly, it’s hard to argue that Core i5 hasn’t just done that. Intel’s Core i5-12600K is the new mainstream CPU champion in virtually every metric that matters.
Note: When you purchase something after clicking links in our articles, we may earn a small commission. Read our affiliate link policy for more details.
One of founding fathers of hardcore tech reporting, Gordon has been covering PCs and components since 1998.
Leave a Reply Cancel reply
document.addEventListener(‘DOMContentLoaded’, function () {
var commentForms = document.getElementsByClassName(‘jetpack_remote_comment’);
for (var i = 0; i < commentForms.length; i++) {
commentForms[i].allowTransparency = false;
commentForms.scrolling = 'no';
}
});
<!–